
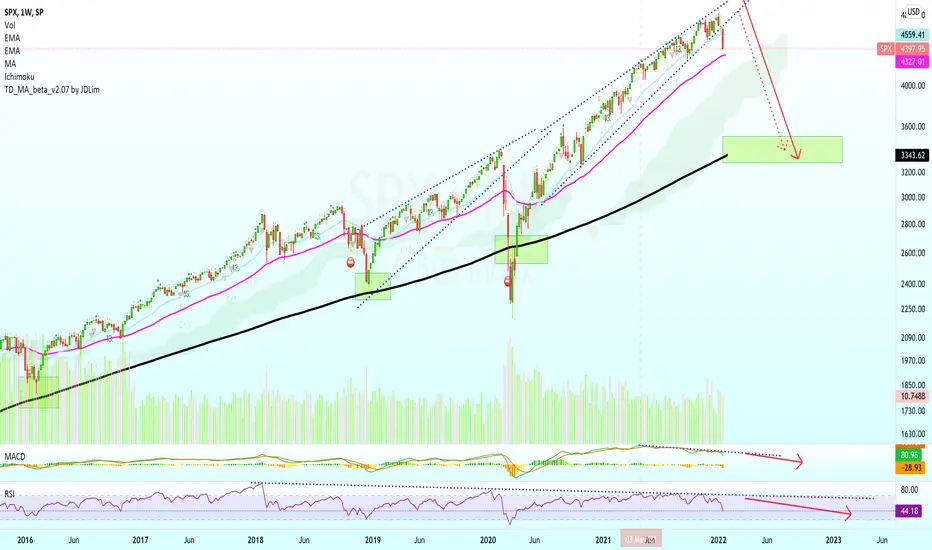
The worst is yet to come, brace yourself.
The S&P 500 index is the TOP index in the USA and represents the state of the economy in this country... Things are not looking good.
We can see that the SPX has been printing bearish divergence with the MACD and RSI for a long-time, once these divergences are in a correction always follows.
The MACD peaked in May 2021, it followed with lower highs.
The SPX continued to print higher highs:
The RSI peaked 22-Jan. 2018, a multiple years long bearish divergence.
We can see lower highs while it continues to trend lower:
Now, as for the SPX prices are still trading above EMA50 (4327) which is the main support.
If this level holds, there can be a recovery.
Below this level, a very strong crash style March 2020 is expected.
We do not expect a bounce at EMA50 but instead a very strong crash.
This is repeating across multiple markets.
I will share the Nasdaq chart as well as the Dow Jones Industrial Averages and Bitcoin, all red.
Feel free to leave us a comment.
Namaste.
The S&P 500 index is the TOP index in the USA and represents the state of the economy in this country... Things are not looking good.
We can see that the SPX has been printing bearish divergence with the MACD and RSI for a long-time, once these divergences are in a correction always follows.
The MACD peaked in May 2021, it followed with lower highs.
The SPX continued to print higher highs:
The RSI peaked 22-Jan. 2018, a multiple years long bearish divergence.
We can see lower highs while it continues to trend lower:
Now, as for the SPX prices are still trading above EMA50 (4327) which is the main support.
If this level holds, there can be a recovery.
Below this level, a very strong crash style March 2020 is expected.
We do not expect a bounce at EMA50 but instead a very strong crash.
This is repeating across multiple markets.
I will share the Nasdaq chart as well as the Dow Jones Industrial Averages and Bitcoin, all red.
Feel free to leave us a comment.
Namaste.

Trading Cryptocurrencies can be the hardest undertaking ever without the right trade-numbers, without accurate private-access information. Free is free, but the best always requires sweat, an investment. Since 2017 👇
t.me/masteranandatrades/8778
t.me/masteranandatrades/8778
관련 발행물
면책사항
해당 정보와 게시물은 금융, 투자, 트레이딩 또는 기타 유형의 조언이나 권장 사항으로 간주되지 않으며, 트레이딩뷰에서 제공하거나 보증하는 것이 아닙니다. 자세한 내용은 이용 약관을 참조하세요.
Trading Cryptocurrencies can be the hardest undertaking ever without the right trade-numbers, without accurate private-access information. Free is free, but the best always requires sweat, an investment. Since 2017 👇
t.me/masteranandatrades/8778
t.me/masteranandatrades/8778
관련 발행물
면책사항
해당 정보와 게시물은 금융, 투자, 트레이딩 또는 기타 유형의 조언이나 권장 사항으로 간주되지 않으며, 트레이딩뷰에서 제공하거나 보증하는 것이 아닙니다. 자세한 내용은 이용 약관을 참조하세요.