
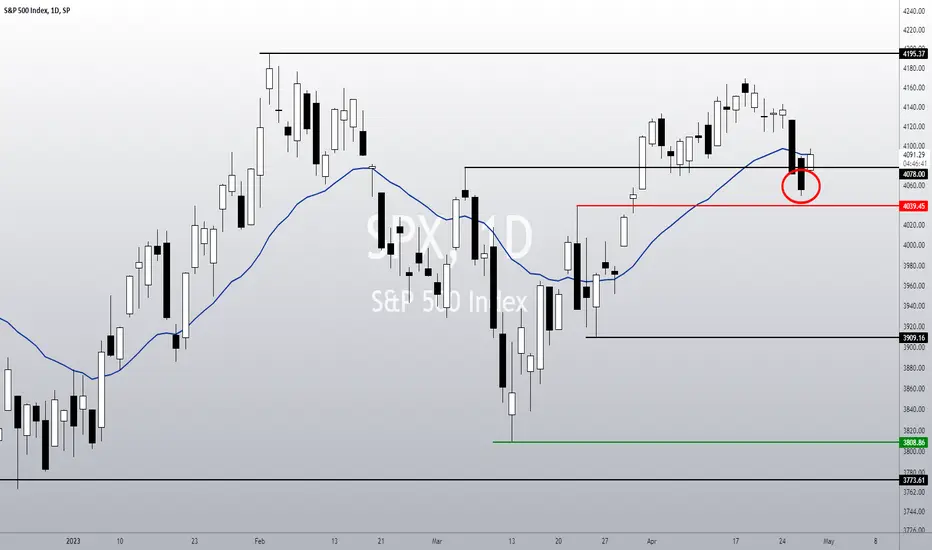
• The SPX is doing a bullish reaction today, which could become a bottom signal and a possible bullish reversal – but it is too soon for this;
• Since the SPX lost the 4,078 support line, it was supposed to hit the next support line around 4,039. However, it is did bullish reaction in a “no man’s land”, and now it is trading above the 4,078 again;
• I say it is a “no man’s land” because it is reacting exactly between the 4,078 and 4,039 support lines;
• What’s the problem with this bullish reaction? The SPX is still struggling to break a few key resistance levels. As seen in the daily chart, the 21 ema is holding the price.

• In the 1h chart, the trend is still very bearish, as the index is still doing lower highs/lows, and it is below the 21 ema – which by the way, is also acting as a resistance today;
• Therefore, this bullish reaction could be just a bounce to the 21 ema, before another drop to the 4,039;
• In addition to the 21 ema, in the 1h chart, we see the black line at 4,113, and a purple trend line connecting the previous top levels on it. Both lines are supposed to act as resistance levels;
• The SPX could reverse, but it just won’t be easy, as it has yet to break its short-term resistances in order to trigger a bullish reversal pattern. Only then, we can go on and say that the index is confirming a bottom, and the 4,170s will be our next target. For now, let's wait for confirmation.
I’ll keep you updated on this. Remember to follow me to keep in touch with my daily analysis.
• Since the SPX lost the 4,078 support line, it was supposed to hit the next support line around 4,039. However, it is did bullish reaction in a “no man’s land”, and now it is trading above the 4,078 again;
• I say it is a “no man’s land” because it is reacting exactly between the 4,078 and 4,039 support lines;
• What’s the problem with this bullish reaction? The SPX is still struggling to break a few key resistance levels. As seen in the daily chart, the 21 ema is holding the price.
• In the 1h chart, the trend is still very bearish, as the index is still doing lower highs/lows, and it is below the 21 ema – which by the way, is also acting as a resistance today;
• Therefore, this bullish reaction could be just a bounce to the 21 ema, before another drop to the 4,039;
• In addition to the 21 ema, in the 1h chart, we see the black line at 4,113, and a purple trend line connecting the previous top levels on it. Both lines are supposed to act as resistance levels;
• The SPX could reverse, but it just won’t be easy, as it has yet to break its short-term resistances in order to trigger a bullish reversal pattern. Only then, we can go on and say that the index is confirming a bottom, and the 4,170s will be our next target. For now, let's wait for confirmation.
I’ll keep you updated on this. Remember to follow me to keep in touch with my daily analysis.

관련 발행물
면책사항
해당 정보와 게시물은 금융, 투자, 트레이딩 또는 기타 유형의 조언이나 권장 사항으로 간주되지 않으며, 트레이딩뷰에서 제공하거나 보증하는 것이 아닙니다. 자세한 내용은 이용 약관을 참조하세요.
면책사항
해당 정보와 게시물은 금융, 투자, 트레이딩 또는 기타 유형의 조언이나 권장 사항으로 간주되지 않으며, 트레이딩뷰에서 제공하거나 보증하는 것이 아닙니다. 자세한 내용은 이용 약관을 참조하세요.