
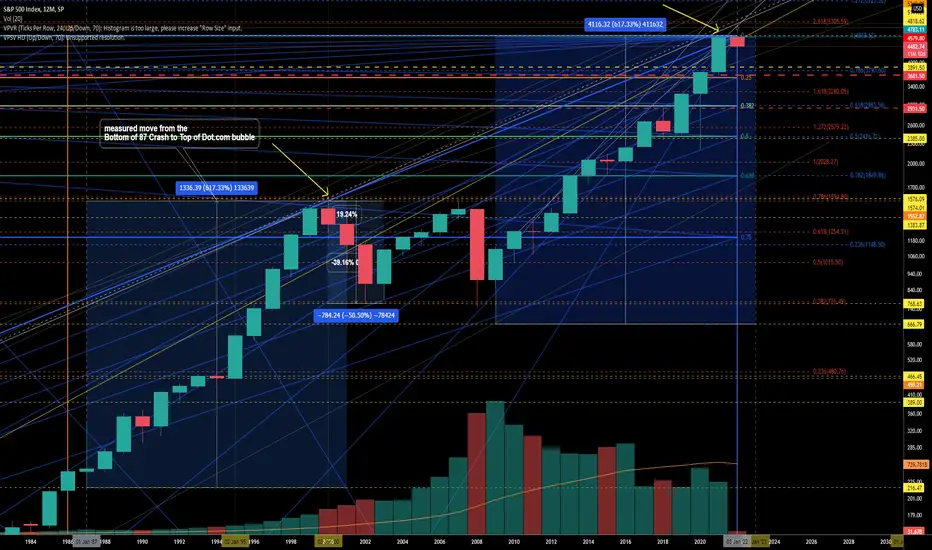
Months back I decided to attempt to predict a local topping of the S&P 500 in various ways. One symbolic aspect was to compare the moves of a previous crash to an asset bubble top... Simply measured the bottom of the '87 Crash to the top of the Dot.com Bubble -- I measured from the bottom of the Financial crisis crash to where that equal percentage move would be. In hindsight, I find this even more interesting over the past few weeks... Thus far, the recent topping was near 35 points of the symbolic measured move.

면책사항
해당 정보와 게시물은 금융, 투자, 트레이딩 또는 기타 유형의 조언이나 권장 사항으로 간주되지 않으며, 트레이딩뷰에서 제공하거나 보증하는 것이 아닙니다. 자세한 내용은 이용 약관을 참조하세요.
면책사항
해당 정보와 게시물은 금융, 투자, 트레이딩 또는 기타 유형의 조언이나 권장 사항으로 간주되지 않으며, 트레이딩뷰에서 제공하거나 보증하는 것이 아닙니다. 자세한 내용은 이용 약관을 참조하세요.