
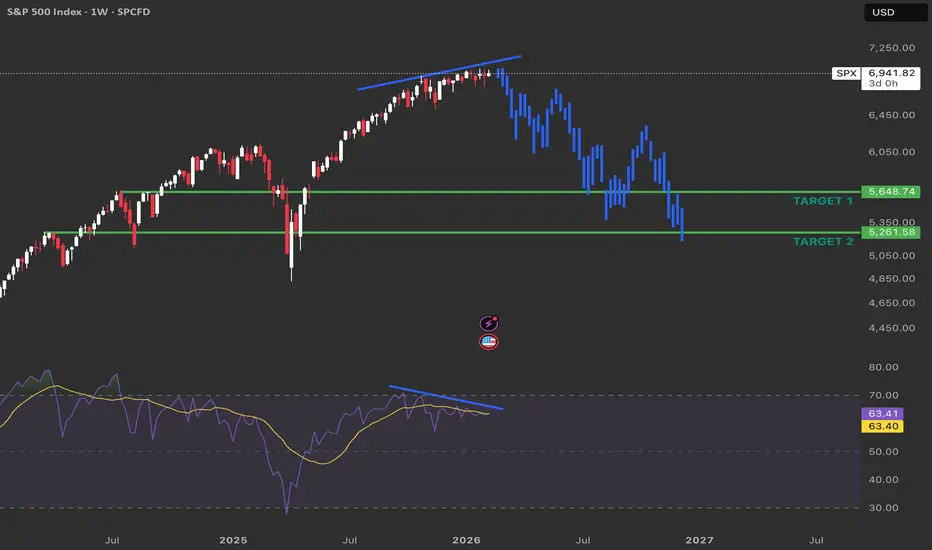
The S&P 500 is still holding near highs, but under the surface, things are starting to weaken. Both the chart and the economy are sending warning signs that are easy to miss if you only look at price.
Weekly Bearish Divergence
On the weekly chart, price made higher highs, but momentum did not. This is called a bearish divergence and it often shows up near the end of long uptrends.
It doesn’t mean the market crashes immediately but it usually means upside is running out of fuel.
A Fractal From the 2021 Bear Market
The projected move on the chart is based on what happened in 2021–2022:
- momentum faded
- price stayed high for a while
- then the market broke down and turned volatile
The current structure looks similar not identical, but familiar enough to be cautious.
The Economy Is Slowing
While prices are high, the economy is cooling:
- Layoffs in January 2026 were the highest since 2009
- There are now fewer job openings than unemployed people
- Wage growth is slowing
- Home sellers heavily outnumber buyers
- Consumer spending is weakening
These are classic late-cycle signals.
Bonds, Rates, and Pressure
Big foreign holders are selling U.S. bonds, pushing yields even higher. This creates pressure on stocks.
What This Means
When you combine:
- fading momentum on the chart
- a setup similar to past bear markets
- weaker jobs and spending
- stress in housing and bonds
You get a market that looks strong on the surface, but is losing strength underneath.
Conclusion
This doesn’t mean a crash tomorrow. But it does suggest that the S&P 500 may be entering a bear-market phase, not just a normal pullback.
Markets usually warn before they turn and right now, those warnings are getting louder.
Weekly Bearish Divergence
On the weekly chart, price made higher highs, but momentum did not. This is called a bearish divergence and it often shows up near the end of long uptrends.
It doesn’t mean the market crashes immediately but it usually means upside is running out of fuel.
A Fractal From the 2021 Bear Market
The projected move on the chart is based on what happened in 2021–2022:
- momentum faded
- price stayed high for a while
- then the market broke down and turned volatile
The current structure looks similar not identical, but familiar enough to be cautious.
The Economy Is Slowing
While prices are high, the economy is cooling:
- Layoffs in January 2026 were the highest since 2009
- There are now fewer job openings than unemployed people
- Wage growth is slowing
- Home sellers heavily outnumber buyers
- Consumer spending is weakening
These are classic late-cycle signals.
Bonds, Rates, and Pressure
Big foreign holders are selling U.S. bonds, pushing yields even higher. This creates pressure on stocks.
What This Means
When you combine:
- fading momentum on the chart
- a setup similar to past bear markets
- weaker jobs and spending
- stress in housing and bonds
You get a market that looks strong on the surface, but is losing strength underneath.
Conclusion
This doesn’t mean a crash tomorrow. But it does suggest that the S&P 500 may be entering a bear-market phase, not just a normal pullback.
Markets usually warn before they turn and right now, those warnings are getting louder.

관련 발행물
면책사항
해당 정보와 게시물은 금융, 투자, 트레이딩 또는 기타 유형의 조언이나 권장 사항으로 간주되지 않으며, 트레이딩뷰에서 제공하거나 보증하는 것이 아닙니다. 자세한 내용은 이용 약관을 참조하세요.
면책사항
해당 정보와 게시물은 금융, 투자, 트레이딩 또는 기타 유형의 조언이나 권장 사항으로 간주되지 않으며, 트레이딩뷰에서 제공하거나 보증하는 것이 아닙니다. 자세한 내용은 이용 약관을 참조하세요.