
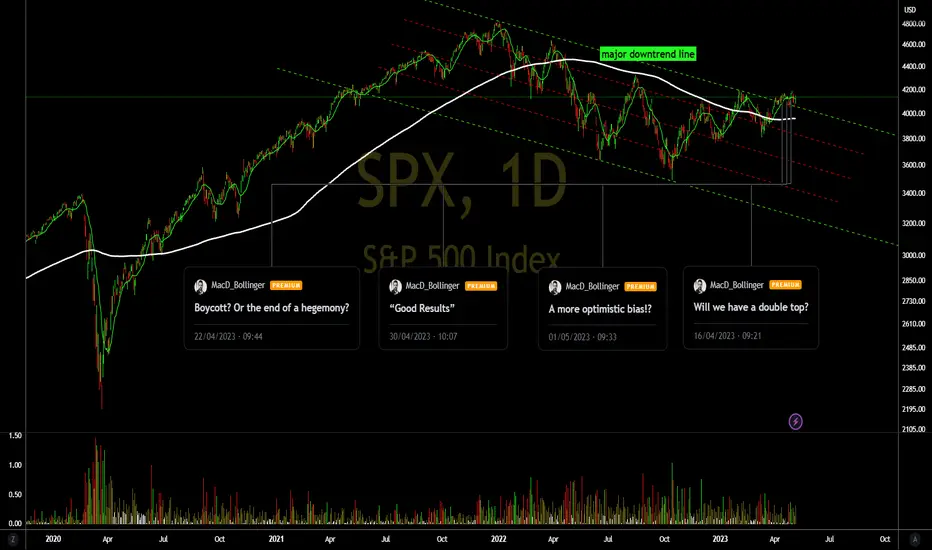
-In previous analysis, prices showed that they could try to force a sharper rise, however, based on technical/graphical analysis, I see that prices tend to only seek the region of 4248.
-If prices do not break through the informed region, we can strongly correct and look for support at 4052.
-On the hourly chart we have prices orbiting the long average, and for me this type of chart pattern is not a very reliable signal, because if prices choose one of the sides to follow (go up or down), they tend to be more intense.

-We have many events to be digested by investors so that we can have at least one path to follow, so caution is the best medicine for the moment!
-See previous graphical analysis!

-Do your analysis and good business.
-Be Aware, If You Buy, Use Stop!
-See below for other graphic analysis.
-If prices do not break through the informed region, we can strongly correct and look for support at 4052.
-On the hourly chart we have prices orbiting the long average, and for me this type of chart pattern is not a very reliable signal, because if prices choose one of the sides to follow (go up or down), they tend to be more intense.
-We have many events to be digested by investors so that we can have at least one path to follow, so caution is the best medicine for the moment!
-See previous graphical analysis!
-Do your analysis and good business.
-Be Aware, If You Buy, Use Stop!
-See below for other graphic analysis.

관련 발행물
면책사항
해당 정보와 게시물은 금융, 투자, 트레이딩 또는 기타 유형의 조언이나 권장 사항으로 간주되지 않으며, 트레이딩뷰에서 제공하거나 보증하는 것이 아닙니다. 자세한 내용은 이용 약관을 참조하세요.
관련 발행물
면책사항
해당 정보와 게시물은 금융, 투자, 트레이딩 또는 기타 유형의 조언이나 권장 사항으로 간주되지 않으며, 트레이딩뷰에서 제공하거나 보증하는 것이 아닙니다. 자세한 내용은 이용 약관을 참조하세요.