
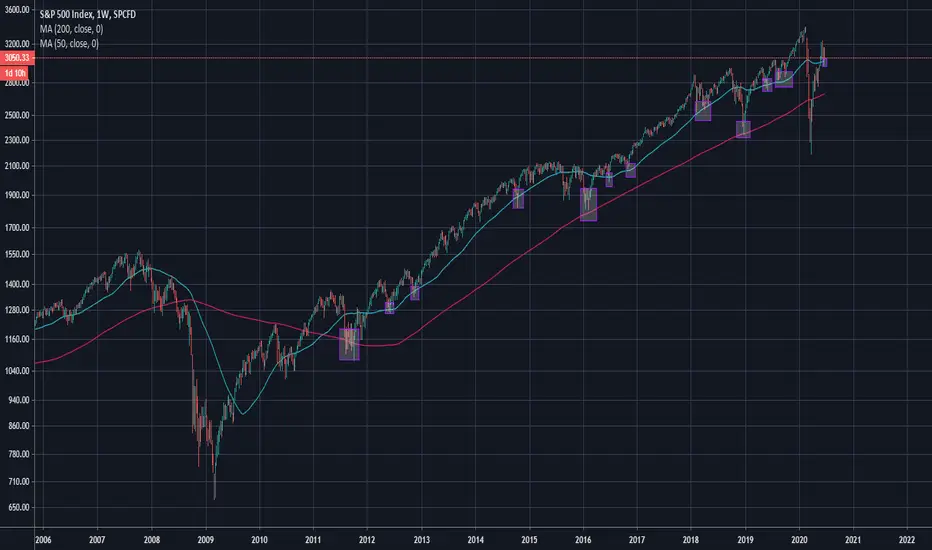
Starting in 2011 this you can see this pattern over and over with the 50 weekly MA. Out of the money put options seem like an interesting hedge against this issue as we sit so close to the 50 MA line. If the market goes up the majority of the portfolio should do great. The put option could then be sold at reduced price to get some time value out. If price goes down it would reduce the losses of the over all portfolio.

More examples of this pattern

Where we are at now
More examples of this pattern
Where we are at now

면책사항
해당 정보와 게시물은 금융, 투자, 트레이딩 또는 기타 유형의 조언이나 권장 사항으로 간주되지 않으며, 트레이딩뷰에서 제공하거나 보증하는 것이 아닙니다. 자세한 내용은 이용 약관을 참조하세요.
면책사항
해당 정보와 게시물은 금융, 투자, 트레이딩 또는 기타 유형의 조언이나 권장 사항으로 간주되지 않으며, 트레이딩뷰에서 제공하거나 보증하는 것이 아닙니다. 자세한 내용은 이용 약관을 참조하세요.