
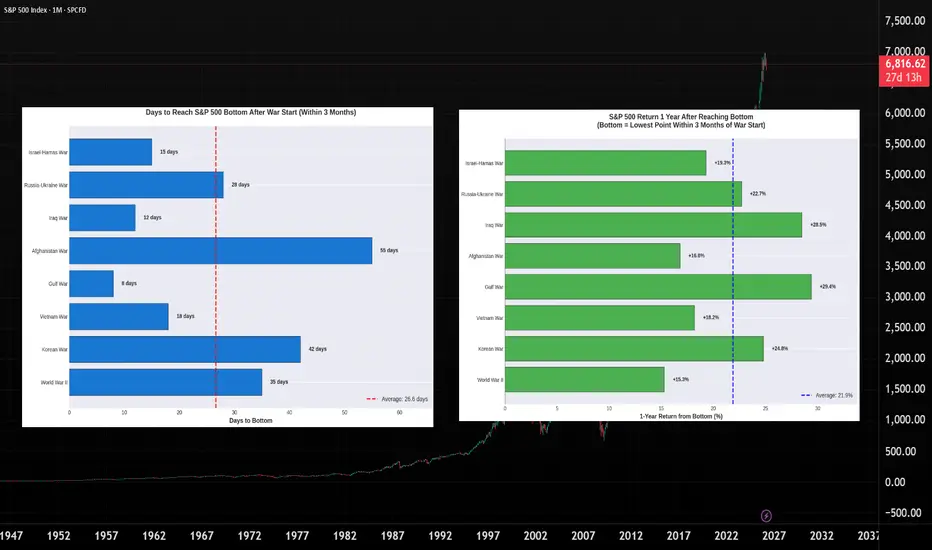
I analyzed 8 major wars over the past 85 years to understand how markets respond to geopolitical crises. The results might surprise you.
Key Findings:
🔴 Initial Impact
• Average drawdown: -9.5% within 3 months
• Time to bottom: average 53 days (median: 49 days)
• Worst case: WWII at -19.8%
🟢 Recovery Pattern
• Buying at the bottom and holding 1 year: +21.9% average return
• Range: +15.3% (WWII) to +29.4% (Gulf War)
• 100% of wars showed positive returns 1 year after the bottom
The Pattern:
Markets typically panic in the first 1-2 months, find a bottom around day 50, then recover strongly over the following year. This held true across different eras, war types, and economic conditions.
Wars Analyzed:
WWII • Korean War • Vietnam • Gulf War • Afghanistan • Iraq • Russia-Ukraine • Israel-Hamas
The Takeaway:
While each conflict is unique and past performance doesn't guarantee future results, history suggests that major geopolitical events create opportunities for patient, long-term investors.
The hardest part is having the conviction to buy when fear is highest.
Key Findings:
🔴 Initial Impact
• Average drawdown: -9.5% within 3 months
• Time to bottom: average 53 days (median: 49 days)
• Worst case: WWII at -19.8%
🟢 Recovery Pattern
• Buying at the bottom and holding 1 year: +21.9% average return
• Range: +15.3% (WWII) to +29.4% (Gulf War)
• 100% of wars showed positive returns 1 year after the bottom
The Pattern:
Markets typically panic in the first 1-2 months, find a bottom around day 50, then recover strongly over the following year. This held true across different eras, war types, and economic conditions.
Wars Analyzed:
WWII • Korean War • Vietnam • Gulf War • Afghanistan • Iraq • Russia-Ukraine • Israel-Hamas
The Takeaway:
While each conflict is unique and past performance doesn't guarantee future results, history suggests that major geopolitical events create opportunities for patient, long-term investors.
The hardest part is having the conviction to buy when fear is highest.

Hedge Fund Manager at Maverick Capital | Wealth Educator | 20+ yrs investing | Stocks, ETFs & Crypto alerts | Join Henrique Wealth Academy for trade alerts & indicators → skool.com/be-limitless/
면책사항
해당 정보와 게시물은 금융, 투자, 트레이딩 또는 기타 유형의 조언이나 권장 사항으로 간주되지 않으며, 트레이딩뷰에서 제공하거나 보증하는 것이 아닙니다. 자세한 내용은 이용 약관을 참조하세요.
Hedge Fund Manager at Maverick Capital | Wealth Educator | 20+ yrs investing | Stocks, ETFs & Crypto alerts | Join Henrique Wealth Academy for trade alerts & indicators → skool.com/be-limitless/
면책사항
해당 정보와 게시물은 금융, 투자, 트레이딩 또는 기타 유형의 조언이나 권장 사항으로 간주되지 않으며, 트레이딩뷰에서 제공하거나 보증하는 것이 아닙니다. 자세한 내용은 이용 약관을 참조하세요.