
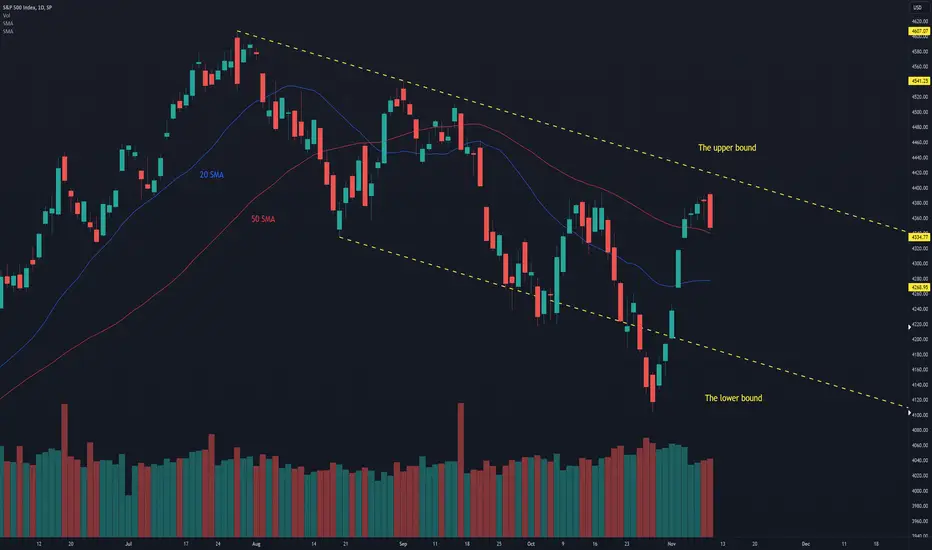
As the Chinese stocks are starting to show signs of weakness after a few days of upside movement, we expect the same scenario to play out in the U.S. market. With that said, the setup we introduced in a previous article remains valid. To support a thesis about a bearish reversal, we want to see MACD fail at breaking into the bullish zone on the daily chart; in addition to that, we want to see RSI and Stochastic continue declining.
Illustration 1.01

Illustration 1.01 shows two Chinese stock market indices we are paying close attention to.
Illustration 1.02

The picture above shows the weekly chart of MACD. A breakout below the midpoint is something to watch in the following weeks. If MACD succeeds in breaking below zero points, it will be very bearish.
Technical analysis gauge
Daily time frame = Slightly bearish
Weekly time frame = Bearish
*The gauge does not necessarily indicate where the market will head. Instead, it reflects the constellation of RSI, MACD, Stochastic, DM+-, ADX, and moving averages.
Please feel free to express your ideas and thoughts in the comment section.
DISCLAIMER: This analysis is not intended to encourage any buying or selling of any particular securities. Furthermore, it should not be a basis for taking any trade action by an individual investor. Therefore, your own due diligence is highly advised before entering a trade.
Illustration 1.01
Illustration 1.01 shows two Chinese stock market indices we are paying close attention to.
Illustration 1.02
The picture above shows the weekly chart of MACD. A breakout below the midpoint is something to watch in the following weeks. If MACD succeeds in breaking below zero points, it will be very bearish.
Technical analysis gauge
Daily time frame = Slightly bearish
Weekly time frame = Bearish
*The gauge does not necessarily indicate where the market will head. Instead, it reflects the constellation of RSI, MACD, Stochastic, DM+-, ADX, and moving averages.
Please feel free to express your ideas and thoughts in the comment section.
DISCLAIMER: This analysis is not intended to encourage any buying or selling of any particular securities. Furthermore, it should not be a basis for taking any trade action by an individual investor. Therefore, your own due diligence is highly advised before entering a trade.

관련 발행물
면책사항
해당 정보와 게시물은 금융, 투자, 트레이딩 또는 기타 유형의 조언이나 권장 사항으로 간주되지 않으며, 트레이딩뷰에서 제공하거나 보증하는 것이 아닙니다. 자세한 내용은 이용 약관을 참조하세요.
관련 발행물
면책사항
해당 정보와 게시물은 금융, 투자, 트레이딩 또는 기타 유형의 조언이나 권장 사항으로 간주되지 않으며, 트레이딩뷰에서 제공하거나 보증하는 것이 아닙니다. 자세한 내용은 이용 약관을 참조하세요.