
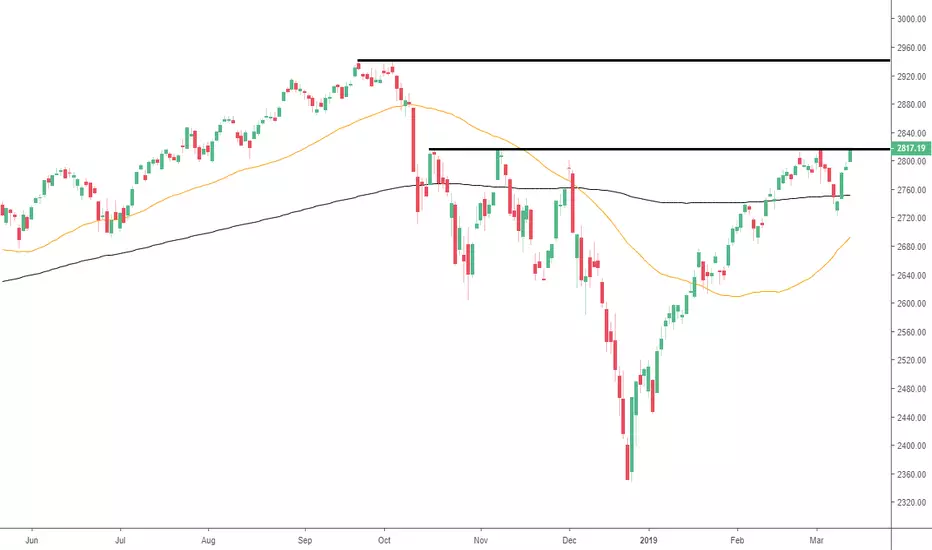
Last post: Nov 20th 2018. See chart.
Review: Price was heading down and moved below the weekly 50 simple moving average.
Update: The market has reversed since then and is now back above the 50 simple moving average and trying to break the current resistance level.
Conclusion: We need to see if price can break the resistance level and continue to move higher and eventually break the previous all-time high.
Any comments or questions, do not hesitate to leave them below. Give us the thumbs up if you share our sentiments!
Sublime Trading
Review: Price was heading down and moved below the weekly 50 simple moving average.
Update: The market has reversed since then and is now back above the 50 simple moving average and trying to break the current resistance level.
Conclusion: We need to see if price can break the resistance level and continue to move higher and eventually break the previous all-time high.
Any comments or questions, do not hesitate to leave them below. Give us the thumbs up if you share our sentiments!
Sublime Trading

Join Our Private Community
bit.ly/join-ST-community
Plus Get Our Ultimate Stock Market Blueprint.
bit.ly/join-ST-community
Plus Get Our Ultimate Stock Market Blueprint.
면책사항
해당 정보와 게시물은 금융, 투자, 트레이딩 또는 기타 유형의 조언이나 권장 사항으로 간주되지 않으며, 트레이딩뷰에서 제공하거나 보증하는 것이 아닙니다. 자세한 내용은 이용 약관을 참조하세요.
Join Our Private Community
bit.ly/join-ST-community
Plus Get Our Ultimate Stock Market Blueprint.
bit.ly/join-ST-community
Plus Get Our Ultimate Stock Market Blueprint.
면책사항
해당 정보와 게시물은 금융, 투자, 트레이딩 또는 기타 유형의 조언이나 권장 사항으로 간주되지 않으며, 트레이딩뷰에서 제공하거나 보증하는 것이 아닙니다. 자세한 내용은 이용 약관을 참조하세요.