
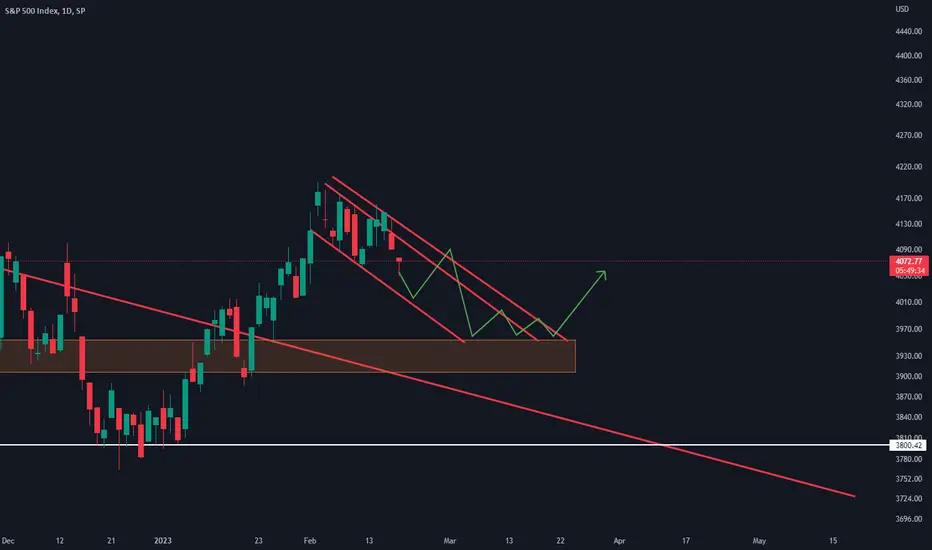
It looks like the SPX has topped out temporarily. This woudn't be too farfetched as the previous couple uptrends lasted for 34, 36, 21, 23, 40, and 33 days. Right now, we're looking at a top which has been formed after 28 days.
From the looks of it, its trying to form a falling channel. The properties of this pattern are:
- Declining parralel support and resistance lines
- Price oscilating between the support and resistance lines
- Bottom at an important support zone
- Going sideways after hitting the bottom, preferibly with a daily bullish divergence
I'm still bullish on the SPX for 2023, but for now i'm expecting a small correction.

면책사항
해당 정보와 게시물은 금융, 투자, 트레이딩 또는 기타 유형의 조언이나 권장 사항으로 간주되지 않으며, 트레이딩뷰에서 제공하거나 보증하는 것이 아닙니다. 자세한 내용은 이용 약관을 참조하세요.
면책사항
해당 정보와 게시물은 금융, 투자, 트레이딩 또는 기타 유형의 조언이나 권장 사항으로 간주되지 않으며, 트레이딩뷰에서 제공하거나 보증하는 것이 아닙니다. 자세한 내용은 이용 약관을 참조하세요.