
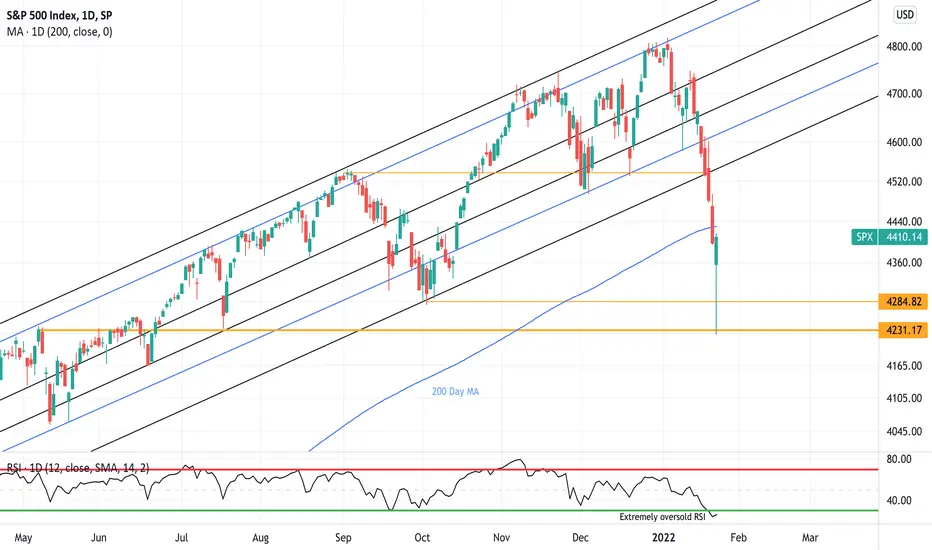
SPX found ground at 4231 Support.
A beautiful hammer candlestick showed up on the daily chart today. A hammer candlestick indicates a potential price reversal to the upside. The price must start moving up following the hammer; this would confirm the reversal.
RSI extremely oversold at 20.
The Federal Reserves FOMC meeting tomorrow [01/25/2022], and Wednesday [01/26/2022] should help provide further direction of the market.
If dovish; expect a major rally. If hawkish; look out below.
Updates to follow.
*Trade the charts, not the noise that comes with corrections*
A beautiful hammer candlestick showed up on the daily chart today. A hammer candlestick indicates a potential price reversal to the upside. The price must start moving up following the hammer; this would confirm the reversal.
RSI extremely oversold at 20.
The Federal Reserves FOMC meeting tomorrow [01/25/2022], and Wednesday [01/26/2022] should help provide further direction of the market.
If dovish; expect a major rally. If hawkish; look out below.
Updates to follow.
*Trade the charts, not the noise that comes with corrections*

면책사항
해당 정보와 게시물은 금융, 투자, 트레이딩 또는 기타 유형의 조언이나 권장 사항으로 간주되지 않으며, 트레이딩뷰에서 제공하거나 보증하는 것이 아닙니다. 자세한 내용은 이용 약관을 참조하세요.
면책사항
해당 정보와 게시물은 금융, 투자, 트레이딩 또는 기타 유형의 조언이나 권장 사항으로 간주되지 않으며, 트레이딩뷰에서 제공하거나 보증하는 것이 아닙니다. 자세한 내용은 이용 약관을 참조하세요.