
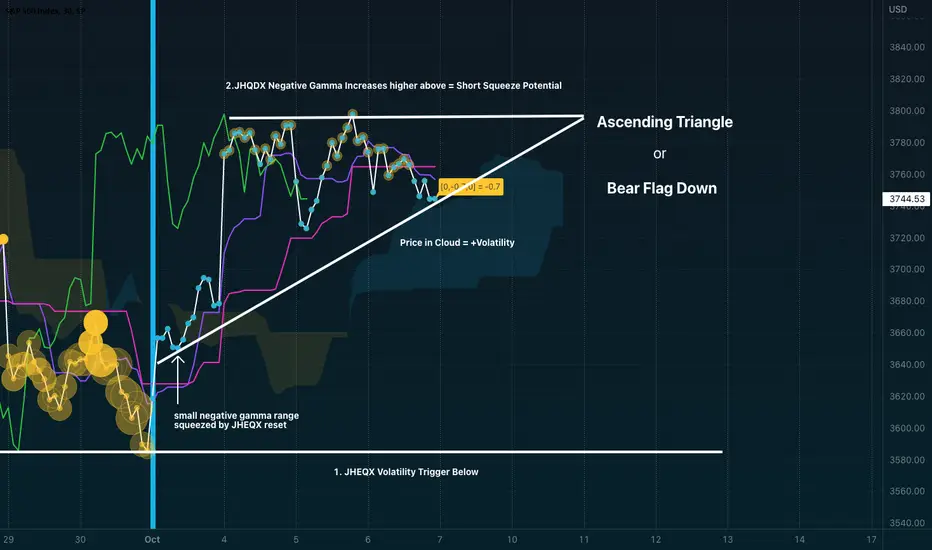
Here is the new indicator on the 30 min timeframe.
I wrote it to read daily SPX even in smaller timeframes so you can get more frequent updates on gamma and delta.
Combine with Ichimoku Cloud and some TA and you got some predictable outcomes to build hedging, swing trades or even scalping short squeeze bottoms.
Ascending Triangle is a perfect example of volatility compression.
Higher at top of triangle = Volatility
Rising lower trend line = Support
Vix is playing its part.
Below trendline = volatility compressing 🤷
Above trendline = volatility compressing 🤷
I think this sideways chop with squeezes higher or dumps overnight / AM continue until CPI on the 13th.

관련 발행물
면책사항
해당 정보와 게시물은 금융, 투자, 트레이딩 또는 기타 유형의 조언이나 권장 사항으로 간주되지 않으며, 트레이딩뷰에서 제공하거나 보증하는 것이 아닙니다. 자세한 내용은 이용 약관을 참조하세요.
관련 발행물
면책사항
해당 정보와 게시물은 금융, 투자, 트레이딩 또는 기타 유형의 조언이나 권장 사항으로 간주되지 않으며, 트레이딩뷰에서 제공하거나 보증하는 것이 아닙니다. 자세한 내용은 이용 약관을 참조하세요.