
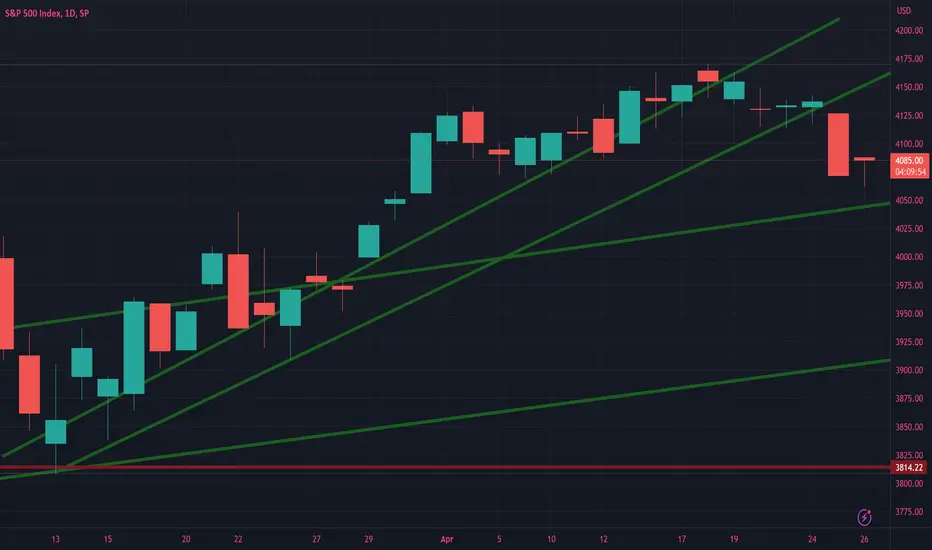
We found support from the selloff that bottomed and ended on the 3/13/23 from a scribble i had given you in the chart's months prior.
The lines i gave you going forward i have used to buy anytime we are at the bottom of my lines and sell anytime we are at the next line above it and or overly extended away from the top line all together and then rebuy when we come back to the line.
If you look at the chart you clearly see on a DAILY basis this chart and these lines have given you a simple way to often DAILY buy the bottoms and sell the tops of just about any major stock in the index. Go ahead and double check if you like.
IF something is working for YOU and or someone you follow gave you some SIMPLE formula to work with and its working. Then don't over think/over complicate the trading you intend to do by gutting caught up in the NOISE that happens daily on the stage.
The lines i gave you going forward i have used to buy anytime we are at the bottom of my lines and sell anytime we are at the next line above it and or overly extended away from the top line all together and then rebuy when we come back to the line.
If you look at the chart you clearly see on a DAILY basis this chart and these lines have given you a simple way to often DAILY buy the bottoms and sell the tops of just about any major stock in the index. Go ahead and double check if you like.
IF something is working for YOU and or someone you follow gave you some SIMPLE formula to work with and its working. Then don't over think/over complicate the trading you intend to do by gutting caught up in the NOISE that happens daily on the stage.

면책사항
해당 정보와 게시물은 금융, 투자, 트레이딩 또는 기타 유형의 조언이나 권장 사항으로 간주되지 않으며, 트레이딩뷰에서 제공하거나 보증하는 것이 아닙니다. 자세한 내용은 이용 약관을 참조하세요.
면책사항
해당 정보와 게시물은 금융, 투자, 트레이딩 또는 기타 유형의 조언이나 권장 사항으로 간주되지 않으며, 트레이딩뷰에서 제공하거나 보증하는 것이 아닙니다. 자세한 내용은 이용 약관을 참조하세요.