
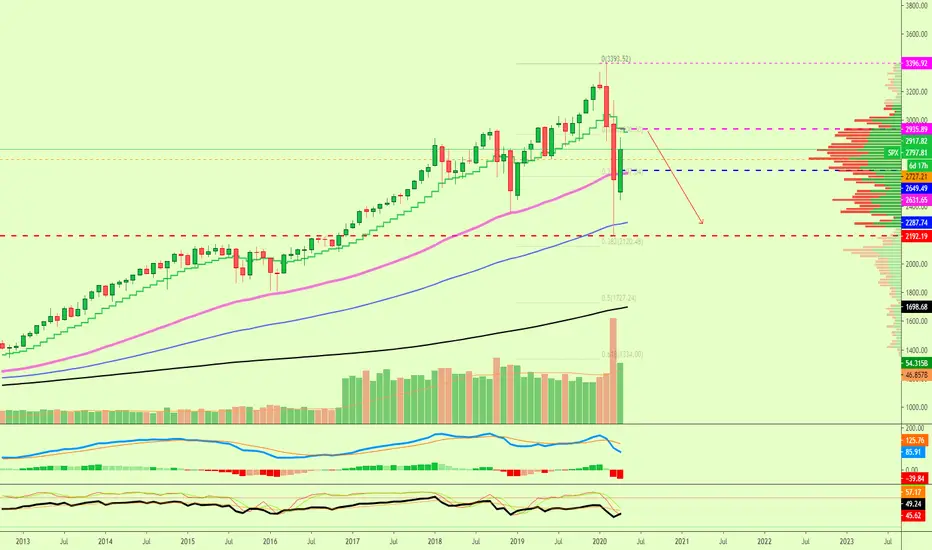
I was looking at the target that I shared for the "upcoming" drop and wrote on it "Worst-case scenario"... but really I didn't mean this and I actually believe that prices can go even lower in a worst-case scenario.
I wanted to share the updated target here in the case a very bad scenario is printed on this chart.
Below you can find the yearly chart (12 Months per candle) and the updated "worst-case scenario" target

If it gets really bad, then 1330 can easily break and prices go lower and hit 770+ before reversing up.
Below you can find the previous chart:
Thanks a lot for reading.
Namaste.
I wanted to share the updated target here in the case a very bad scenario is printed on this chart.
Below you can find the yearly chart (12 Months per candle) and the updated "worst-case scenario" target
If it gets really bad, then 1330 can easily break and prices go lower and hit 770+ before reversing up.
Below you can find the previous chart:
Thanks a lot for reading.
Namaste.

✅ Cryptocurrencies technical analysis & results
t.me/masteranandatrades/9279
✅ Stocks technical analysis
t.me/anandastocks
✅ PREMIUM · Enjoyed the content?
t.me/lamatrades/4 (🔝 since 2017)
t.me/masteranandatrades/9279
✅ Stocks technical analysis
t.me/anandastocks
✅ PREMIUM · Enjoyed the content?
t.me/lamatrades/4 (🔝 since 2017)
면책사항
해당 정보와 게시물은 금융, 투자, 트레이딩 또는 기타 유형의 조언이나 권장 사항으로 간주되지 않으며, 트레이딩뷰에서 제공하거나 보증하는 것이 아닙니다. 자세한 내용은 이용 약관을 참조하세요.
✅ Cryptocurrencies technical analysis & results
t.me/masteranandatrades/9279
✅ Stocks technical analysis
t.me/anandastocks
✅ PREMIUM · Enjoyed the content?
t.me/lamatrades/4 (🔝 since 2017)
t.me/masteranandatrades/9279
✅ Stocks technical analysis
t.me/anandastocks
✅ PREMIUM · Enjoyed the content?
t.me/lamatrades/4 (🔝 since 2017)
면책사항
해당 정보와 게시물은 금융, 투자, 트레이딩 또는 기타 유형의 조언이나 권장 사항으로 간주되지 않으며, 트레이딩뷰에서 제공하거나 보증하는 것이 아닙니다. 자세한 내용은 이용 약관을 참조하세요.