
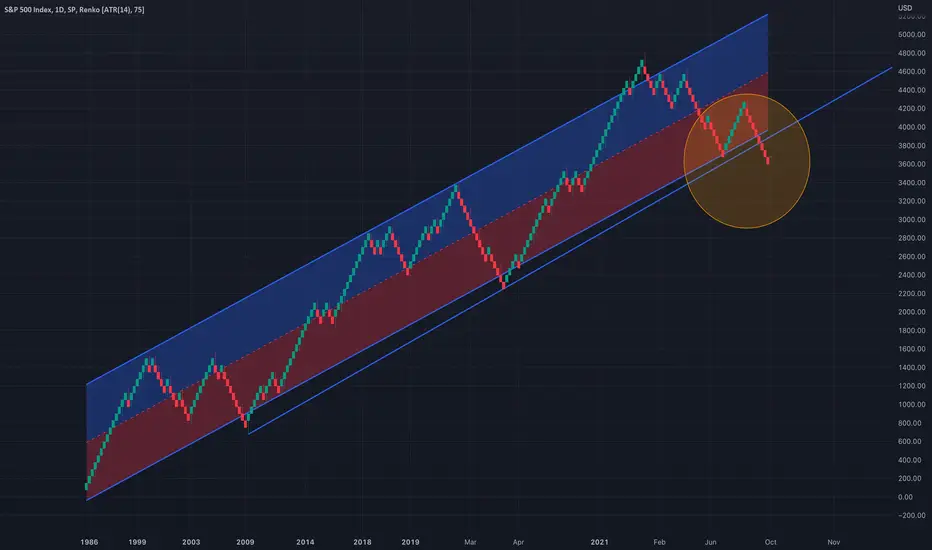
SPX has clearly violated a trend line of this Renko chart.
After a false-breakout of the channel, now we progress further downwards.
This chart may suggest that even though we have had consistent growth for the last years, every time we cover less and less ground upwards. The next leg up, may lead us to the bottom of the channel and a rejection. Only then we can understand some further stuff and see if this chart made sense in the first place. Maybe the meaning of this chart is nonexistent. Do however take a look at the other main indices.
DJI is performing better than the other indices this year.

NDX
I drew a shorter trendline, it made the most sense to do so.

SPX/PPIACO
We are just a 13.5% drop to get to the 2000 peak.

NDX/PPIACO

DJI/PPIACO
I did an automatic regression trend on it to make it more "official" looking. Notice that the 2008 bottom is an outlier in the trend.
In the SPX/PPIACO and NDX/PPIACO charts, I drew some trends that looked good to me at the time. Price seemed to get interested in these trends.

I just added a regression on NDX/PPIACO
Trust me, at the time I drew the trendlines, I drew them in a way that made sense to the price. And as you see the regression paints the same picture.

PS. Maybe we will enter the trend again sometime in the future. We probably will. As for now, he may have more pain ahead of us.
Tread lightly, for this is hallowed ground.
Father Grigori
After a false-breakout of the channel, now we progress further downwards.
This chart may suggest that even though we have had consistent growth for the last years, every time we cover less and less ground upwards. The next leg up, may lead us to the bottom of the channel and a rejection. Only then we can understand some further stuff and see if this chart made sense in the first place. Maybe the meaning of this chart is nonexistent. Do however take a look at the other main indices.
DJI is performing better than the other indices this year.
NDX
I drew a shorter trendline, it made the most sense to do so.
SPX/PPIACO
We are just a 13.5% drop to get to the 2000 peak.
NDX/PPIACO
DJI/PPIACO
I did an automatic regression trend on it to make it more "official" looking. Notice that the 2008 bottom is an outlier in the trend.
In the SPX/PPIACO and NDX/PPIACO charts, I drew some trends that looked good to me at the time. Price seemed to get interested in these trends.
I just added a regression on NDX/PPIACO
Trust me, at the time I drew the trendlines, I drew them in a way that made sense to the price. And as you see the regression paints the same picture.
PS. Maybe we will enter the trend again sometime in the future. We probably will. As for now, he may have more pain ahead of us.
Tread lightly, for this is hallowed ground.
Father Grigori
노트
The regression channel I use has a deviation setting of :Upper Deviation = 1.618
Lower Deviation = -1.618
I like some gold(en ratio) in my charts.

관련 발행물
면책사항
해당 정보와 게시물은 금융, 투자, 트레이딩 또는 기타 유형의 조언이나 권장 사항으로 간주되지 않으며, 트레이딩뷰에서 제공하거나 보증하는 것이 아닙니다. 자세한 내용은 이용 약관을 참조하세요.
면책사항
해당 정보와 게시물은 금융, 투자, 트레이딩 또는 기타 유형의 조언이나 권장 사항으로 간주되지 않으며, 트레이딩뷰에서 제공하거나 보증하는 것이 아닙니다. 자세한 내용은 이용 약관을 참조하세요.