
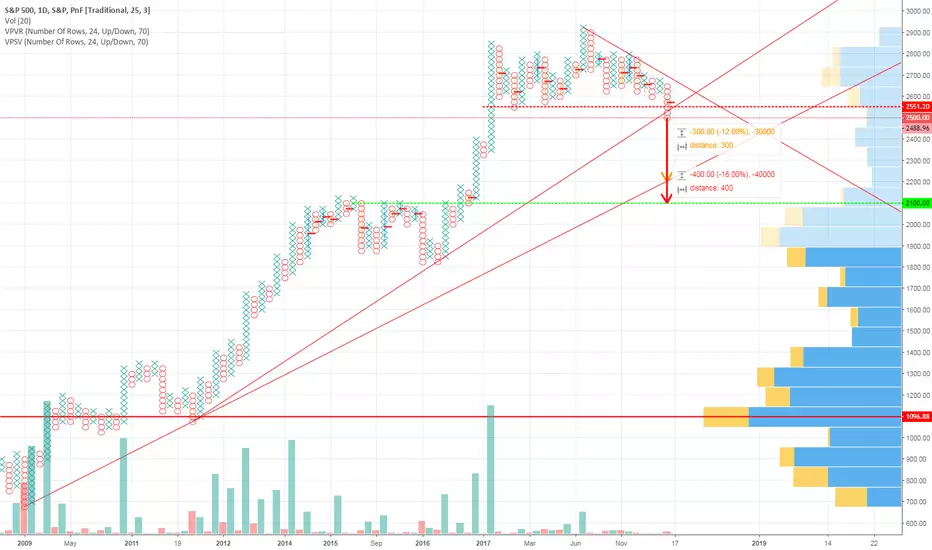
This is a corrective/bearish outlook on S&P500 Index based on Point & Figure charting.
The Index managed to breach below the first uptrend line around the 2,550 level. Based on P&F charting (which is, arguably, one of the oldest charting techniques used in the western hemisphere), I expect the Index to dip to the second major uptrend line @ 2,200 points (-12% from 2,500 level) as a first target. My second expected target is around the peak of the first consolidation seen on the chart @ 2,100 points (-16% from 2,500). The third expected target, albeit far-fetched but remains a possibility, has been derived from the horizontal-counting and not shown on the chart, is 1,750 points (-30% from 2,500) points.
It should be noted that the P&F chart used has been setup as 25x3
*Always remember; this is an opinion, not a recommendation*

면책사항
해당 정보와 게시물은 금융, 투자, 트레이딩 또는 기타 유형의 조언이나 권장 사항으로 간주되지 않으며, 트레이딩뷰에서 제공하거나 보증하는 것이 아닙니다. 자세한 내용은 이용 약관을 참조하세요.
면책사항
해당 정보와 게시물은 금융, 투자, 트레이딩 또는 기타 유형의 조언이나 권장 사항으로 간주되지 않으며, 트레이딩뷰에서 제공하거나 보증하는 것이 아닙니다. 자세한 내용은 이용 약관을 참조하세요.