
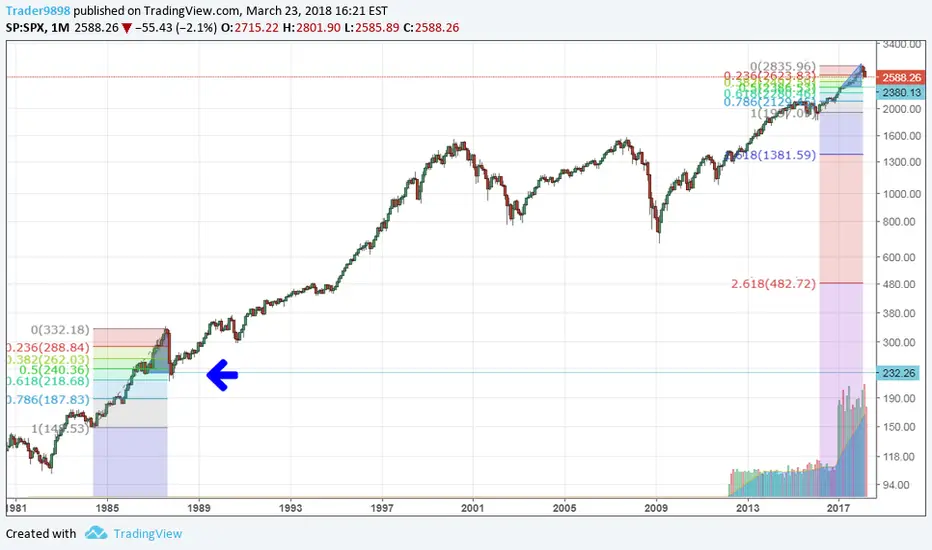
This is a re-post of a chart from one month ago after the dow dropped 700 points in one day. My extrapolation from that post compared this to 1987, in which there was a 2 year run up, and then a quick crash which erased 1 years worth of gains.
While this 2018 crash appears to be slower in time than 1987's two month crash period, the charts nonetheless look the same to me. If we extrapolate, then SPX's current price has only reached half way to where it will eventually bottom out, which should be around 2380.
While this 2018 crash appears to be slower in time than 1987's two month crash period, the charts nonetheless look the same to me. If we extrapolate, then SPX's current price has only reached half way to where it will eventually bottom out, which should be around 2380.

면책사항
해당 정보와 게시물은 금융, 투자, 트레이딩 또는 기타 유형의 조언이나 권장 사항으로 간주되지 않으며, 트레이딩뷰에서 제공하거나 보증하는 것이 아닙니다. 자세한 내용은 이용 약관을 참조하세요.
면책사항
해당 정보와 게시물은 금융, 투자, 트레이딩 또는 기타 유형의 조언이나 권장 사항으로 간주되지 않으며, 트레이딩뷰에서 제공하거나 보증하는 것이 아닙니다. 자세한 내용은 이용 약관을 참조하세요.