
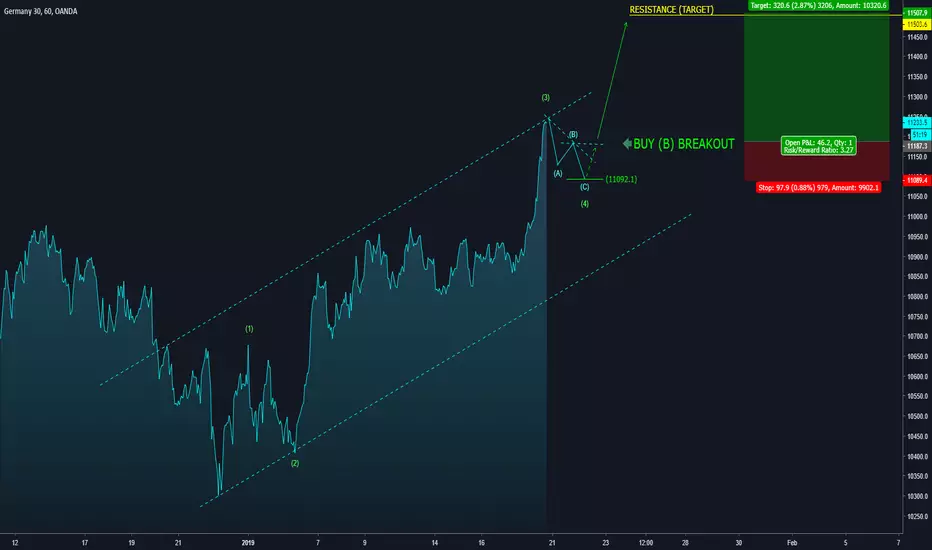
Why consider this chart only as "education"? The answer is very simple, at the moment we do not yet know the corrective structure (ABC) levels, but we only know that the nearest support is around 11,000 and Target around 11.500. That said, the potential setup is very simple: Long on wave (B) breakout and stop loss below wave (c). Unfortunately we can not always use this strategy, but in this case, yes! ;)
The most important thing for a Trader is not the setup, but it's Money Management: Volume Size and R/R Ratio.
The size depends on your balance, while R/R Ratio is shown on the chart, in this case we have a good ratio (>1:3) ... but this is just an example!
NOTE: Each setup can lose no more than 2% of your Capital.
If there are many traders interested in this market, we can follow this index together from Monday, and try some setups in real time, here on TradingView!
If you want to support us, click on Like bottom and stay connected on tradingView!
Thank you for your support!
*** "... your best friend is not the market, but the stop loss!" (C.R.)
The most important thing for a Trader is not the setup, but it's Money Management: Volume Size and R/R Ratio.
The size depends on your balance, while R/R Ratio is shown on the chart, in this case we have a good ratio (>1:3) ... but this is just an example!
NOTE: Each setup can lose no more than 2% of your Capital.
If there are many traders interested in this market, we can follow this index together from Monday, and try some setups in real time, here on TradingView!
If you want to support us, click on Like bottom and stay connected on tradingView!
Thank you for your support!
*** "... your best friend is not the market, but the stop loss!" (C.R.)

면책사항
해당 정보와 게시물은 금융, 투자, 트레이딩 또는 기타 유형의 조언이나 권장 사항으로 간주되지 않으며, 트레이딩뷰에서 제공하거나 보증하는 것이 아닙니다. 자세한 내용은 이용 약관을 참조하세요.
면책사항
해당 정보와 게시물은 금융, 투자, 트레이딩 또는 기타 유형의 조언이나 권장 사항으로 간주되지 않으며, 트레이딩뷰에서 제공하거나 보증하는 것이 아닙니다. 자세한 내용은 이용 약관을 참조하세요.