
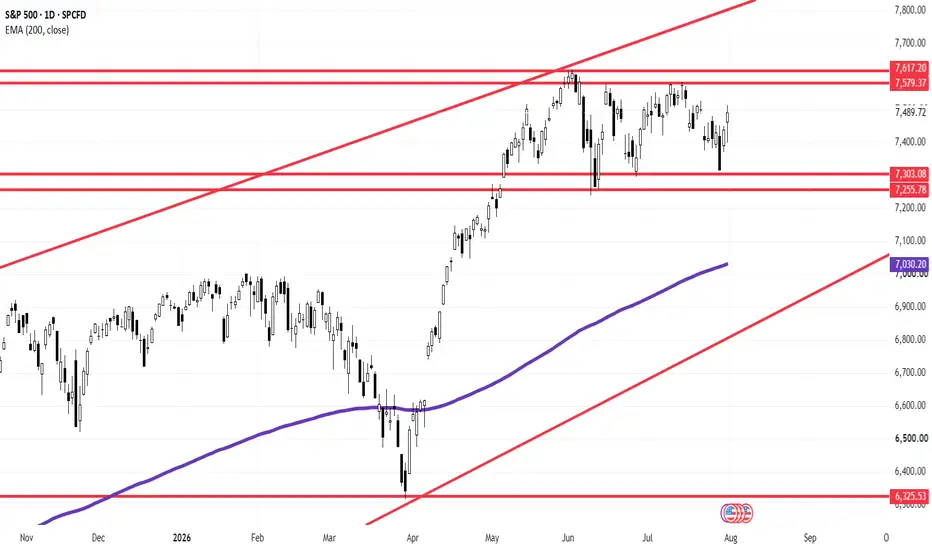
Daily Chart (D1) – Compression Ahead of a Major Volatility Expansion
On the daily timeframe, the S&P 500 (SPX) is currently coiled inside a symmetrical triangle/wedge pattern (green trendlines) following its recent push towards historic highs. This tight consolidation signals that the market is preparing for a significant multi-week directional move once a definitive breakout occurs.
Bullish Continuation Scenario:
The immediate upside hurdle sits at the upper boundary of the green compression structure (~7,550 - 7,580).
A decisive daily close above this trendline clears the pathway for a bullish expansion towards the upper red channel line, targeting 7,700+.
Bearish Correction Scenario:
If the price gets rejected at the upper green trendline and breaks down below the lower support line (~7,320), it will trigger a deeper structural pull-back.
In this breakdown scenario, the primary target for the bears would be the 200-day EMA (currently near 7,030), followed by the primary long-term ascending trendline (red line).
📊 **ChartPro Data**
*European Equity Architecture, Trend Expansion Mechanics & Systematic Risk Management.*
⚠️ **Disclaimer:** For educational and informational purposes only. This active market study represents a personal trading framework and does not constitute financial or investment advice.
On the daily timeframe, the S&P 500 (SPX) is currently coiled inside a symmetrical triangle/wedge pattern (green trendlines) following its recent push towards historic highs. This tight consolidation signals that the market is preparing for a significant multi-week directional move once a definitive breakout occurs.
Bullish Continuation Scenario:
The immediate upside hurdle sits at the upper boundary of the green compression structure (~7,550 - 7,580).
A decisive daily close above this trendline clears the pathway for a bullish expansion towards the upper red channel line, targeting 7,700+.
Bearish Correction Scenario:
If the price gets rejected at the upper green trendline and breaks down below the lower support line (~7,320), it will trigger a deeper structural pull-back.
In this breakdown scenario, the primary target for the bears would be the 200-day EMA (currently near 7,030), followed by the primary long-term ascending trendline (red line).
📊 **ChartPro Data**
*European Equity Architecture, Trend Expansion Mechanics & Systematic Risk Management.*
⚠️ **Disclaimer:** For educational and informational purposes only. This active market study represents a personal trading framework and does not constitute financial or investment advice.

면책사항
해당 정보와 게시물은 금융, 투자, 트레이딩 또는 기타 유형의 조언이나 권장 사항으로 간주되지 않으며, 트레이딩뷰에서 제공하거나 보증하는 것이 아닙니다. 자세한 내용은 이용 약관을 참조하세요.
면책사항
해당 정보와 게시물은 금융, 투자, 트레이딩 또는 기타 유형의 조언이나 권장 사항으로 간주되지 않으며, 트레이딩뷰에서 제공하거나 보증하는 것이 아닙니다. 자세한 내용은 이용 약관을 참조하세요.