
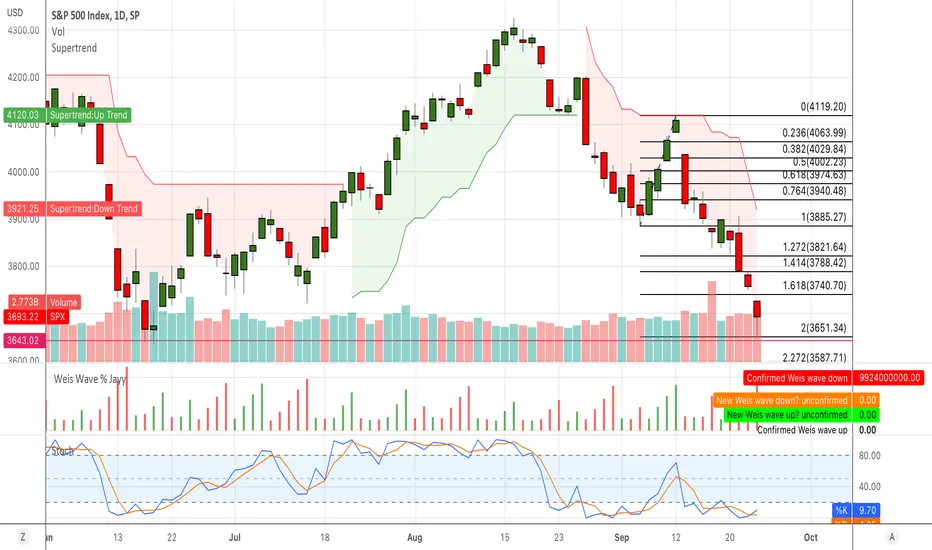
Hammer on the daily chart needs confirmation, but the low price coincides with the Fibonacci level 2 and the static support of the November 2020 high. The stochastic is oversold on the daily, weekly and monthly chart is at 2008 levels. Previous situations always followed by a rebound. On the weekly chart, the rebound occurred followed by an increase in volumes which at this time are still low. Friday's downside stopped at a double low from June 2022. If confirmed, there is a good chance of a rebound. Take care.

면책사항
해당 정보와 게시물은 금융, 투자, 트레이딩 또는 기타 유형의 조언이나 권장 사항으로 간주되지 않으며, 트레이딩뷰에서 제공하거나 보증하는 것이 아닙니다. 자세한 내용은 이용 약관을 참조하세요.
면책사항
해당 정보와 게시물은 금융, 투자, 트레이딩 또는 기타 유형의 조언이나 권장 사항으로 간주되지 않으며, 트레이딩뷰에서 제공하거나 보증하는 것이 아닙니다. 자세한 내용은 이용 약관을 참조하세요.