
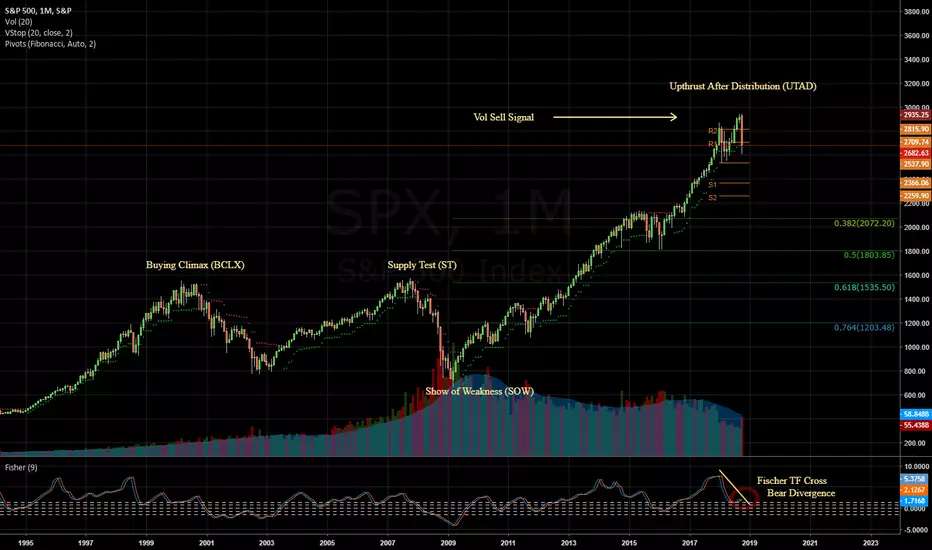
Everyone very focused on the the daily chart need to zoom out and look at weekly, similar to how traders look at the 15 min / 1hr / daily for swing trades. Monthly showing clear distribution on increasing volume. Vol sell signal triggered and would need a close above 2935 to be bullish. Vol stop signal has been extremely accurate on the monthly. Look at the green and red dots. Short the rally's until then.
I am long SPY Dec 2019 $150 puts at .65 avg px
I am long
SPY Dec 2019 $150 puts at .65 avg px
면책사항
해당 정보와 게시물은 금융, 투자, 트레이딩 또는 기타 유형의 조언이나 권장 사항으로 간주되지 않으며, 트레이딩뷰에서 제공하거나 보증하는 것이 아닙니다. 자세한 내용은 이용 약관을 참조하세요.
면책사항
해당 정보와 게시물은 금융, 투자, 트레이딩 또는 기타 유형의 조언이나 권장 사항으로 간주되지 않으며, 트레이딩뷰에서 제공하거나 보증하는 것이 아닙니다. 자세한 내용은 이용 약관을 참조하세요.