
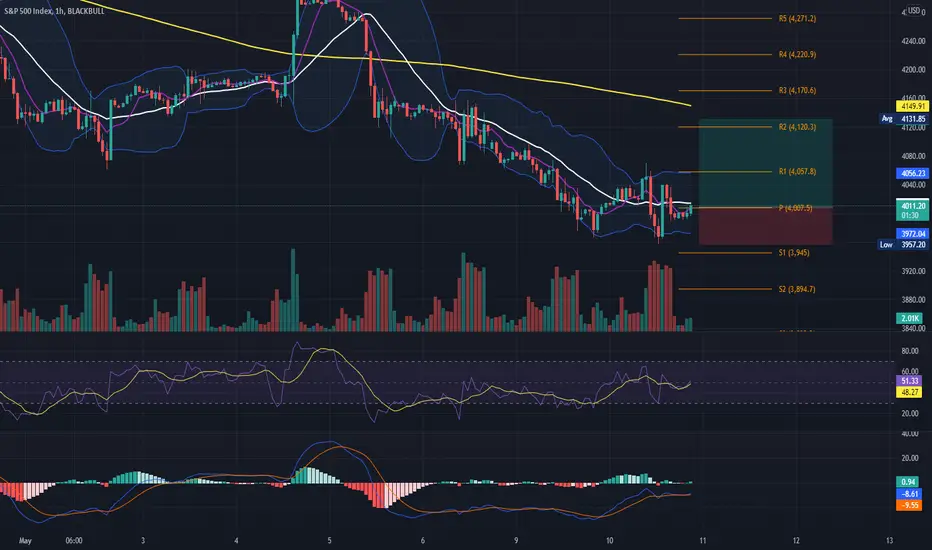
Hey traders, SPX is showing the last correction wave C 1-day frame, which is almost over. The market is bearish, we will see the market going slowly higher, bouncing between the pivot point bands and going up.
Pls remember to check the trend, the price should stay up at the pivot point level and bounce in it, without breaking. If the price goes down the pivot point and then S1, we will switch into a downtrend again.
Pls , see the pivot point levels in the chart.(R1,R2) The market has the last word.
Indicators, MA 200, 20-8 RSI 8 MA8 Bollinger 20, Volume , Pivot points Levels. Intraday Strategy. MACD

면책사항
해당 정보와 게시물은 금융, 투자, 트레이딩 또는 기타 유형의 조언이나 권장 사항으로 간주되지 않으며, 트레이딩뷰에서 제공하거나 보증하는 것이 아닙니다. 자세한 내용은 이용 약관을 참조하세요.
면책사항
해당 정보와 게시물은 금융, 투자, 트레이딩 또는 기타 유형의 조언이나 권장 사항으로 간주되지 않으며, 트레이딩뷰에서 제공하거나 보증하는 것이 아닙니다. 자세한 내용은 이용 약관을 참조하세요.