
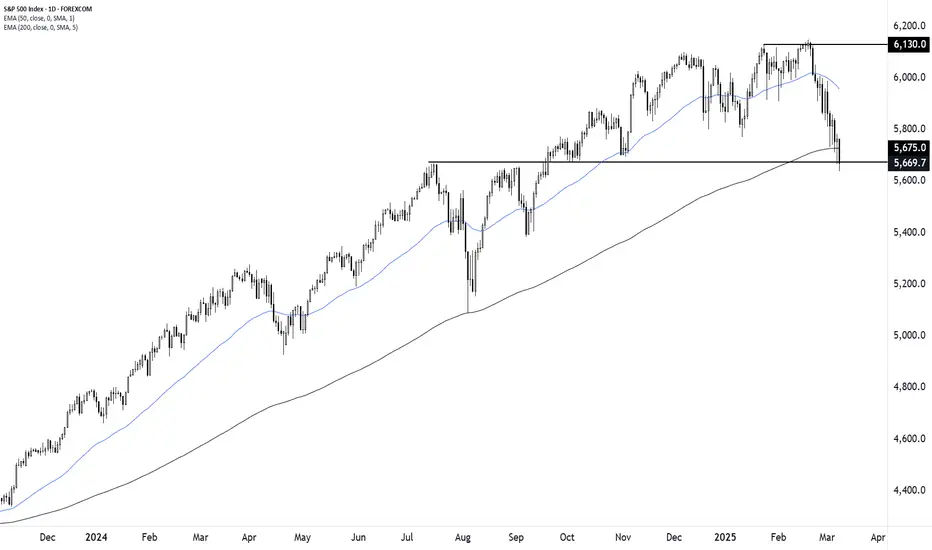
The S&P 500 is showing clear signs of technical weakness as it breaks below a key support level around 5,675, coinciding with the 200-day EMA. This breakdown follows a rejection at 6,130, a recent high that established a resistance zone.
With the index now trading below the 50-day EMA, downside risks are increasing. If the 5,668 level fails to hold, further declines toward the next major support zone could materialize. Traders will be watching for a potential retest of broken support as resistance before determining the next move.
Key Levels to Watch:
📉 Support: 5,668
📈 Resistance: 6,130
-MW

면책사항
해당 정보와 게시물은 금융, 투자, 트레이딩 또는 기타 유형의 조언이나 권장 사항으로 간주되지 않으며, 트레이딩뷰에서 제공하거나 보증하는 것이 아닙니다. 자세한 내용은 이용 약관을 참조하세요.
면책사항
해당 정보와 게시물은 금융, 투자, 트레이딩 또는 기타 유형의 조언이나 권장 사항으로 간주되지 않으며, 트레이딩뷰에서 제공하거나 보증하는 것이 아닙니다. 자세한 내용은 이용 약관을 참조하세요.