
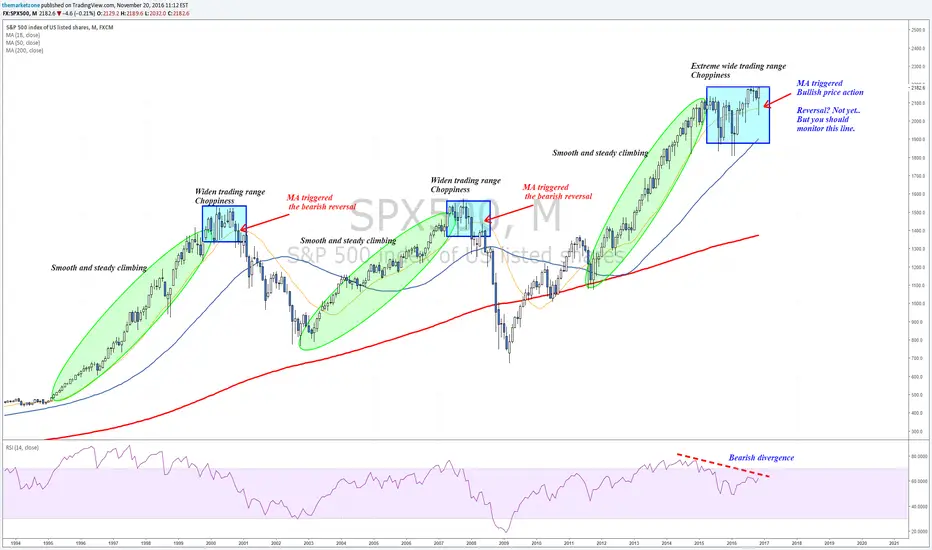
Looking back since 1995 we see clear price behavior pattern in SPX:
1. Smooth and steady climbing of the Index throughout years.
2. Just before a major reversal we see a price action widening and choppiness increase.
3. Bearish reversal following a close below the Fast MA line.
As you can see, since 2015 we are inside the trading range period. It is wider than before and that probably due to the level of engagement of central banks in the markets.
After the elections SPX bounced from the Fast MA line and therefore didn't provide the bearish trigger... instead, it provided a bullish one with strong bullish reaction to the MA line.
Things look like we still have some more upside in SPX but it is limited. We are probably in a wide distribution phase and it'll end when SPX will close again below 2000 (below the Fast and 50 MA lines)
Read more about what's in store for 2017 in this week's newsletter (link in signature)
1. Smooth and steady climbing of the Index throughout years.
2. Just before a major reversal we see a price action widening and choppiness increase.
3. Bearish reversal following a close below the Fast MA line.
As you can see, since 2015 we are inside the trading range period. It is wider than before and that probably due to the level of engagement of central banks in the markets.
After the elections SPX bounced from the Fast MA line and therefore didn't provide the bearish trigger... instead, it provided a bullish one with strong bullish reaction to the MA line.
Things look like we still have some more upside in SPX but it is limited. We are probably in a wide distribution phase and it'll end when SPX will close again below 2000 (below the Fast and 50 MA lines)
Read more about what's in store for 2017 in this week's newsletter (link in signature)
노트
SPX at new record high - Dow Jones approaching the PRZ노트


면책사항
해당 정보와 게시물은 금융, 투자, 트레이딩 또는 기타 유형의 조언이나 권장 사항으로 간주되지 않으며, 트레이딩뷰에서 제공하거나 보증하는 것이 아닙니다. 자세한 내용은 이용 약관을 참조하세요.
면책사항
해당 정보와 게시물은 금융, 투자, 트레이딩 또는 기타 유형의 조언이나 권장 사항으로 간주되지 않으며, 트레이딩뷰에서 제공하거나 보증하는 것이 아닙니다. 자세한 내용은 이용 약관을 참조하세요.