
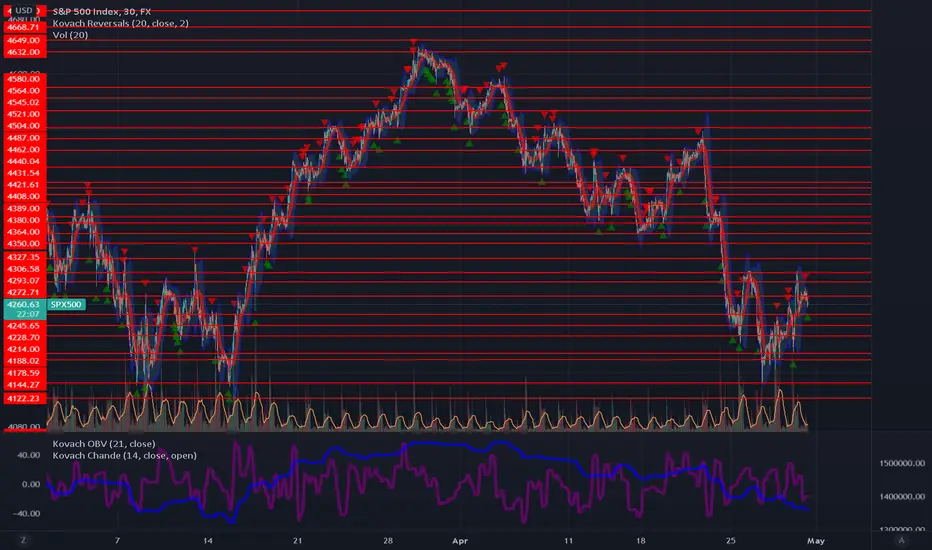
As we mentioned yesterday, stocks got good support from lower levels, but faced resistance at 4306. Recall that we highlighted this as the level to break for the S&P 500 to see higher levels. The KRI indicates that we are seeing strong resistance here. That being said, we could be in the midst of forming an inverse head and shoulders pattern with 4306 as the neckline. Watch for stocks to dip lower and find support above 4144, at 4214 in particular. If we are able to break out then 4364 is the next target.

Join my discord at discord.io/quantguy
관련 발행물
면책사항
해당 정보와 게시물은 금융, 투자, 트레이딩 또는 기타 유형의 조언이나 권장 사항으로 간주되지 않으며, 트레이딩뷰에서 제공하거나 보증하는 것이 아닙니다. 자세한 내용은 이용 약관을 참조하세요.
Join my discord at discord.io/quantguy
관련 발행물
면책사항
해당 정보와 게시물은 금융, 투자, 트레이딩 또는 기타 유형의 조언이나 권장 사항으로 간주되지 않으며, 트레이딩뷰에서 제공하거나 보증하는 것이 아닙니다. 자세한 내용은 이용 약관을 참조하세요.