
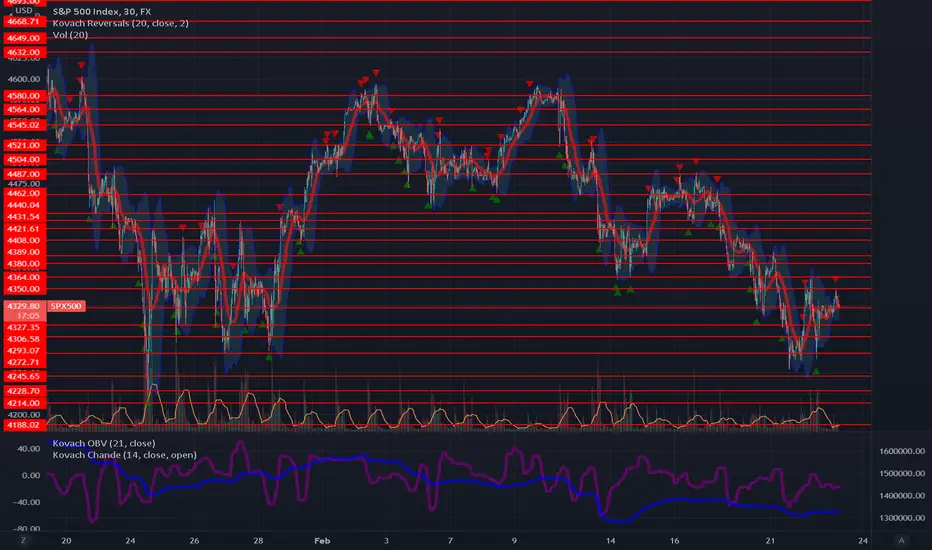
Stocks have been struggling to find footing in the wake of Russia tensions. As we mentioned before, stocks found support at 4272. A green triangle on the KRI confirmed the support here. We are currently attempting a bit of a pivot from here, with 4364 providing resistance for now. We are seeing a (rather messy) inverse head and shoulders type pattern here with a "neckline" at 4364. If we are able to break out from this, we will surely see resistance at 4440, then 4580. The Kovach OBV still is not convinced of any bullishness at this point, and is remaining at lows for now.

Join my discord at discord.io/quantguy
관련 발행물
면책사항
해당 정보와 게시물은 금융, 투자, 트레이딩 또는 기타 유형의 조언이나 권장 사항으로 간주되지 않으며, 트레이딩뷰에서 제공하거나 보증하는 것이 아닙니다. 자세한 내용은 이용 약관을 참조하세요.
Join my discord at discord.io/quantguy
관련 발행물
면책사항
해당 정보와 게시물은 금융, 투자, 트레이딩 또는 기타 유형의 조언이나 권장 사항으로 간주되지 않으며, 트레이딩뷰에서 제공하거나 보증하는 것이 아닙니다. 자세한 내용은 이용 약관을 참조하세요.