
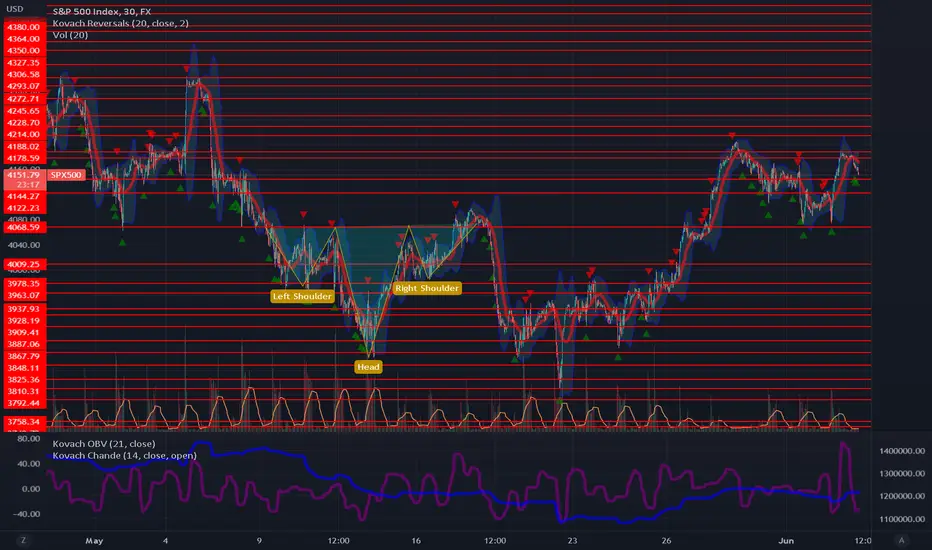
Stocks caught a strong pivot off of our relative low. The relative low of 4068 is significant because it coincides with the neckline of the failed inverse Head and Shoulders pattern from last week. We saw strong support from this level as confirmed by a double bottom with two green triangles on the KRI. We are not quite ready to call a bottom for stocks and a subsequent bull rally, but the fact that 4068 is holding is encouraging. We noted yesterday that our target for stocks was 4219, which we anticipated to hold as a ceiling for now. Sure enough, stocks are testing highs, falling just shy of our target at 4188. The Kovach OBV has picked up, but not enough to suggest there is much more in the tank. But if we are able to break 4219, then 4306 is the next target.

Join my discord at discord.io/quantguy
관련 발행물
면책사항
해당 정보와 게시물은 금융, 투자, 트레이딩 또는 기타 유형의 조언이나 권장 사항으로 간주되지 않으며, 트레이딩뷰에서 제공하거나 보증하는 것이 아닙니다. 자세한 내용은 이용 약관을 참조하세요.
Join my discord at discord.io/quantguy
관련 발행물
면책사항
해당 정보와 게시물은 금융, 투자, 트레이딩 또는 기타 유형의 조언이나 권장 사항으로 간주되지 않으며, 트레이딩뷰에서 제공하거나 보증하는 것이 아닙니다. 자세한 내용은 이용 약관을 참조하세요.