
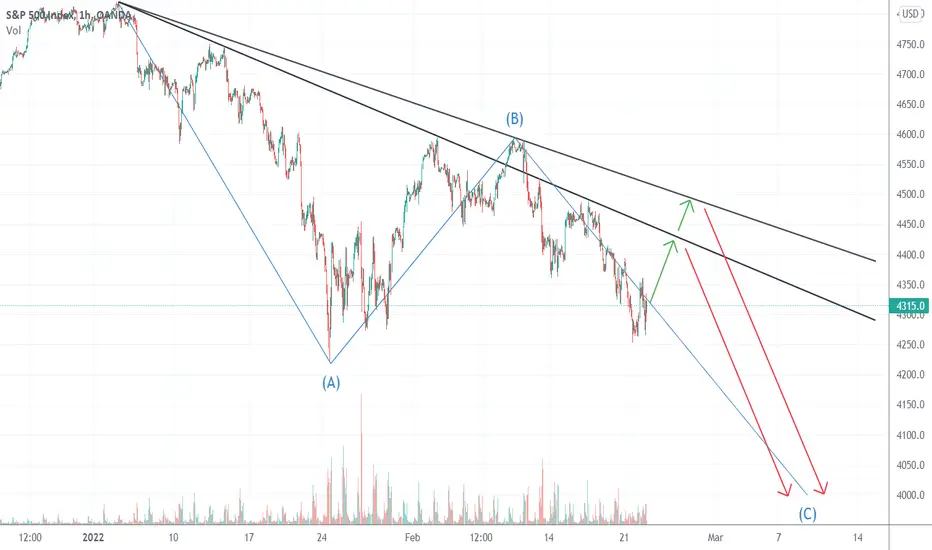
So far, Elliott Wave Theory has done an excellent job of predicting the recent bear market. There was a clear five wave pattern down from A. B retraced exactly 0.618 (the golden ratio) of A. Elliot Wave Theory predicts that we are currently on Wave C, assuming this an ABC pattern. If C extends farther than 161.8% of wave A, the ABC correction pattern is invalidated and a five wave pattern is in progress. This would be the "crash" scenario.
Please see my previous chart for possible Wave C levels. For this chart, I chose 4000 as the most likely level. Given the market action today, it appears a temporary bottom could be forming, and there could be a bounce up to the area shown by the green arrows. I don't see the market continuing higher given fundamentals (Fed policy, inflation, etc.). If the bounce occurs, the entire correction could be fitted into a descending triangle, which is a bearish pattern.
All tips are appreciated:
ETH: 0x13cd45d7d282ee0ee4635645cce2e2a566d9bed8

면책사항
해당 정보와 게시물은 금융, 투자, 트레이딩 또는 기타 유형의 조언이나 권장 사항으로 간주되지 않으며, 트레이딩뷰에서 제공하거나 보증하는 것이 아닙니다. 자세한 내용은 이용 약관을 참조하세요.
면책사항
해당 정보와 게시물은 금융, 투자, 트레이딩 또는 기타 유형의 조언이나 권장 사항으로 간주되지 않으며, 트레이딩뷰에서 제공하거나 보증하는 것이 아닙니다. 자세한 내용은 이용 약관을 참조하세요.