
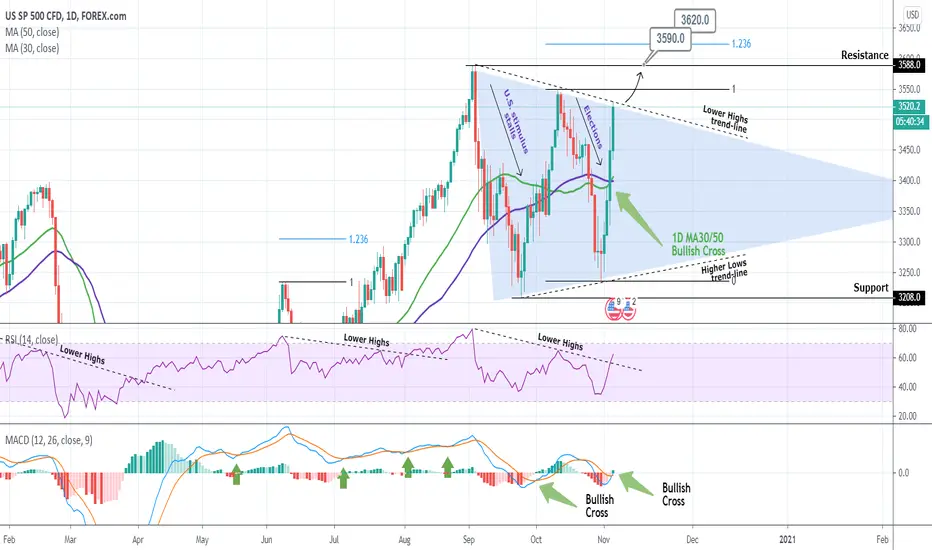
Since the September 03 Top (All Time High), S&P500 has entered a volatile pattern in the form of a Triangle. The major drivers of this weakness have fundamentally been the U.S. stimulus being delayed and then the elections.
Today the Lower Highs trend-line of this Triangle is being tested. If broken, I expect the 3590 Resistance to be tested, with an extension to the 1.236 Fibonacci at 3620 as it happened with the July 23 extension.
The reason I give more probabilities to an upward break-out from the Triangle is the fact that the MACD on the 1D time-frame has (just) formed a Bullish Cross much earlier than the previous time, something that may accumulate buyers. Also the RSI has broken above its Lower Highs trend-line already, something that was a bullish signal 1 year back. On top of that the MA30 just crossed above the MA50 which on a one month horizon at least, has historically been a bullish signal (we have to go years back to see immediate selling after a 1D MA30/50 Bullish Cross.
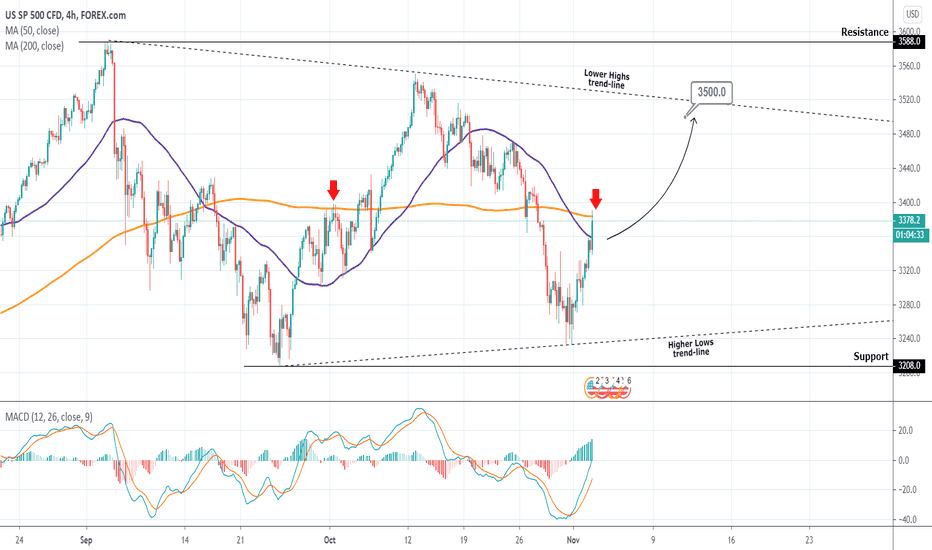
Most recent trade on S&P500:
** Please support this idea with your likes and comments, it is the best way to keep it relevant and support me. **
--------------------------------------------------------------------------------------------------------
!! Donations via TradingView coins also help me a great deal at posting more free trading content and signals here !!
🎉 👍 Shout-out to TradingShot's 💰 top TradingView Coin donor 💰 this week ==> didogetsov
--------------------------------------------------------------------------------------------------------
Today the Lower Highs trend-line of this Triangle is being tested. If broken, I expect the 3590 Resistance to be tested, with an extension to the 1.236 Fibonacci at 3620 as it happened with the July 23 extension.
The reason I give more probabilities to an upward break-out from the Triangle is the fact that the MACD on the 1D time-frame has (just) formed a Bullish Cross much earlier than the previous time, something that may accumulate buyers. Also the RSI has broken above its Lower Highs trend-line already, something that was a bullish signal 1 year back. On top of that the MA30 just crossed above the MA50 which on a one month horizon at least, has historically been a bullish signal (we have to go years back to see immediate selling after a 1D MA30/50 Bullish Cross.
Most recent trade on S&P500:
** Please support this idea with your likes and comments, it is the best way to keep it relevant and support me. **
--------------------------------------------------------------------------------------------------------
!! Donations via TradingView coins also help me a great deal at posting more free trading content and signals here !!
🎉 👍 Shout-out to TradingShot's 💰 top TradingView Coin donor 💰 this week ==> didogetsov
--------------------------------------------------------------------------------------------------------

I trade Crypto, Forex, Indices & Commodities on PrimeXBT — all from one account with TradingView charts 👉 tradingshot.short.gy/PrimeXBT
I also use TradeNation for fixed spreads & zero commission 👉 tradingshot.short.gy/Tradenation
I also use TradeNation for fixed spreads & zero commission 👉 tradingshot.short.gy/Tradenation
면책사항
해당 정보와 게시물은 금융, 투자, 트레이딩 또는 기타 유형의 조언이나 권장 사항으로 간주되지 않으며, 트레이딩뷰에서 제공하거나 보증하는 것이 아닙니다. 자세한 내용은 이용 약관을 참조하세요.
I trade Crypto, Forex, Indices & Commodities on PrimeXBT — all from one account with TradingView charts 👉 tradingshot.short.gy/PrimeXBT
I also use TradeNation for fixed spreads & zero commission 👉 tradingshot.short.gy/Tradenation
I also use TradeNation for fixed spreads & zero commission 👉 tradingshot.short.gy/Tradenation
면책사항
해당 정보와 게시물은 금융, 투자, 트레이딩 또는 기타 유형의 조언이나 권장 사항으로 간주되지 않으며, 트레이딩뷰에서 제공하거나 보증하는 것이 아닙니다. 자세한 내용은 이용 약관을 참조하세요.