
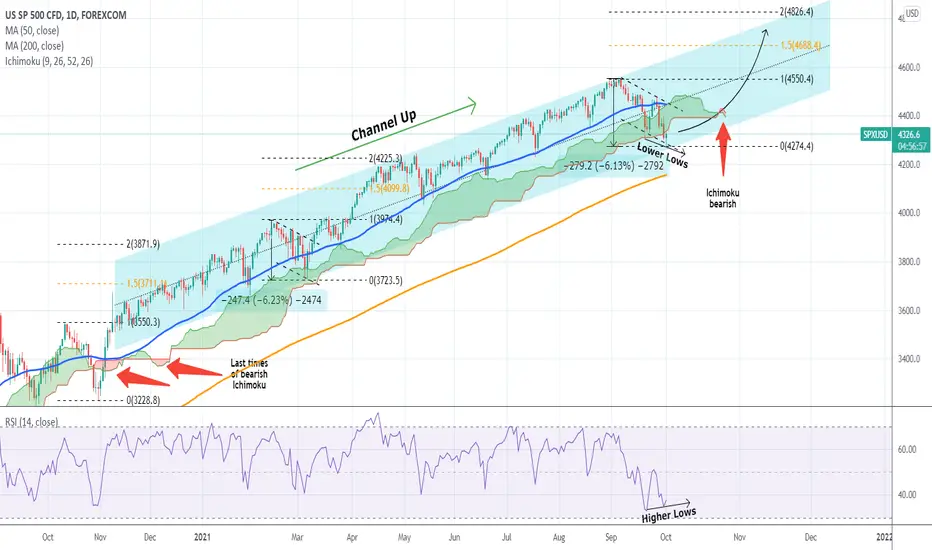
S&P has been trading within a long-term Channel Up ever since the aggressive rebound straight after the November 2020 U.S. elections. Today the price just hit the bottom (Higher Lows trend-line) of that Channel.
There are two high probability scenarios arising after September's pull-back:
a) This pull-back is similar to late February - early March 2021 (both on -6% pull-backs that hit the bottom of the Channel Up.
b) It is similar to the October 30 2020 bottom itself (elections low) as they both broke below the Ichimoku Cloud. In fact the last two times before today that the Ichimoku indicator turned bearish was on December 02 2020 and October 29 2020.
On top of that the 1D RSI is on a bullish divergence as its been on Higher Lows since Sept 20 while the price is on Lower Lows, indicating that the selling might be getting weaker.
If SPX materializes one of those scenarios then we may expect first 4688 and then 4826 by December which is the 1.5 and 2.0 Fibonacci extensions respectively, as both of those a) b) patterns reached those extensions.
** Please support this idea with your likes and comments, it is the best way to keep it relevant and support me. **
--------------------------------------------------------------------------------------------------------
!! Donations via TradingView coins also help me a great deal at posting more free trading content and signals here !!
🎉 👍 Shout-out to TradingShot's 💰 top TradingView Coin donor 💰 this week ==> Vergnes
--------------------------------------------------------------------------------------------------------
There are two high probability scenarios arising after September's pull-back:
a) This pull-back is similar to late February - early March 2021 (both on -6% pull-backs that hit the bottom of the Channel Up.
b) It is similar to the October 30 2020 bottom itself (elections low) as they both broke below the Ichimoku Cloud. In fact the last two times before today that the Ichimoku indicator turned bearish was on December 02 2020 and October 29 2020.
On top of that the 1D RSI is on a bullish divergence as its been on Higher Lows since Sept 20 while the price is on Lower Lows, indicating that the selling might be getting weaker.
If SPX materializes one of those scenarios then we may expect first 4688 and then 4826 by December which is the 1.5 and 2.0 Fibonacci extensions respectively, as both of those a) b) patterns reached those extensions.
** Please support this idea with your likes and comments, it is the best way to keep it relevant and support me. **
--------------------------------------------------------------------------------------------------------
!! Donations via TradingView coins also help me a great deal at posting more free trading content and signals here !!
🎉 👍 Shout-out to TradingShot's 💰 top TradingView Coin donor 💰 this week ==> Vergnes
--------------------------------------------------------------------------------------------------------

I trade Crypto, Forex, Indices & Commodities on PrimeXBT — all from one account with TradingView charts 👉 tradingshot.short.gy/PrimeXBT
I also use TradeNation for fixed spreads & zero commission 👉 tradingshot.short.gy/Tradenation
I also use TradeNation for fixed spreads & zero commission 👉 tradingshot.short.gy/Tradenation
면책사항
해당 정보와 게시물은 금융, 투자, 트레이딩 또는 기타 유형의 조언이나 권장 사항으로 간주되지 않으며, 트레이딩뷰에서 제공하거나 보증하는 것이 아닙니다. 자세한 내용은 이용 약관을 참조하세요.
I trade Crypto, Forex, Indices & Commodities on PrimeXBT — all from one account with TradingView charts 👉 tradingshot.short.gy/PrimeXBT
I also use TradeNation for fixed spreads & zero commission 👉 tradingshot.short.gy/Tradenation
I also use TradeNation for fixed spreads & zero commission 👉 tradingshot.short.gy/Tradenation
면책사항
해당 정보와 게시물은 금융, 투자, 트레이딩 또는 기타 유형의 조언이나 권장 사항으로 간주되지 않으며, 트레이딩뷰에서 제공하거나 보증하는 것이 아닙니다. 자세한 내용은 이용 약관을 참조하세요.