
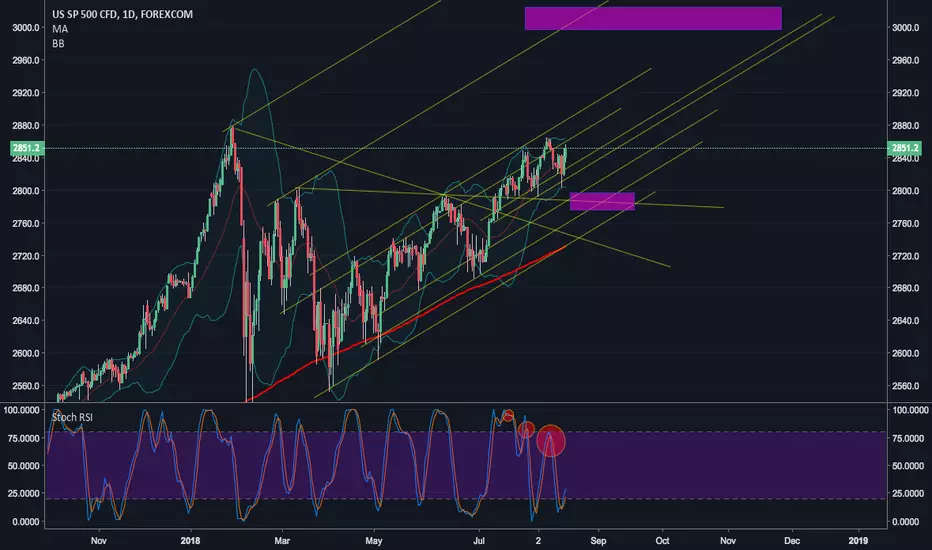
The SP 500 is stair-stepping up parallel support lines, whilst butting up against parallel lines set by March intraday lows. This is technically bullish, and implies that a breakout to the next parallel line is in the cards.
The only concerning point is the successive Stoch RSI bearish divergence. While excessively bullish markets will ignore bearish divergence (and vice versa for bearish markets), the fact that price is close to parallel resistance might suggest that a temporary high could form.
With that said, if a pullback can hold above the breakout line, which is confluence of the parallel lines that have held for the balance of the year, this would be incredibly bullish, and would project a measured move to the 3000 level.
The only concerning point is the successive Stoch RSI bearish divergence. While excessively bullish markets will ignore bearish divergence (and vice versa for bearish markets), the fact that price is close to parallel resistance might suggest that a temporary high could form.
With that said, if a pullback can hold above the breakout line, which is confluence of the parallel lines that have held for the balance of the year, this would be incredibly bullish, and would project a measured move to the 3000 level.

면책사항
해당 정보와 게시물은 금융, 투자, 트레이딩 또는 기타 유형의 조언이나 권장 사항으로 간주되지 않으며, 트레이딩뷰에서 제공하거나 보증하는 것이 아닙니다. 자세한 내용은 이용 약관을 참조하세요.
면책사항
해당 정보와 게시물은 금융, 투자, 트레이딩 또는 기타 유형의 조언이나 권장 사항으로 간주되지 않으며, 트레이딩뷰에서 제공하거나 보증하는 것이 아닙니다. 자세한 내용은 이용 약관을 참조하세요.