
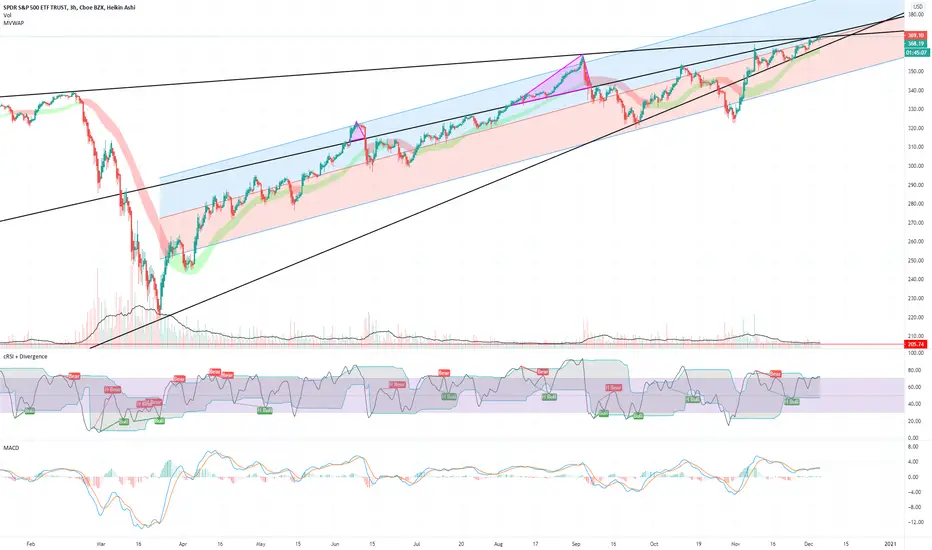
I think this is the simplest but most useful chart that I have for the S&P. No fancy waves or fib levels, just that most basic trend lines, linear regression channel, cRSI, and MACD.
I did add MVWAP indicator, but I have not had a lot of experience with it yet. I wanted something a bit better than the standard 21 day SMA. I set its smoothing to 42 because I am on the 3h timeframe and I wanted a 21 day average.


I did add MVWAP indicator, but I have not had a lot of experience with it yet. I wanted something a bit better than the standard 21 day SMA. I set its smoothing to 42 because I am on the 3h timeframe and I wanted a 21 day average.
노트
2:15pm update노트
End of day. My simple chart got a few more lines.
관련 발행물
면책사항
해당 정보와 게시물은 금융, 투자, 트레이딩 또는 기타 유형의 조언이나 권장 사항으로 간주되지 않으며, 트레이딩뷰에서 제공하거나 보증하는 것이 아닙니다. 자세한 내용은 이용 약관을 참조하세요.
관련 발행물
면책사항
해당 정보와 게시물은 금융, 투자, 트레이딩 또는 기타 유형의 조언이나 권장 사항으로 간주되지 않으며, 트레이딩뷰에서 제공하거나 보증하는 것이 아닙니다. 자세한 내용은 이용 약관을 참조하세요.