
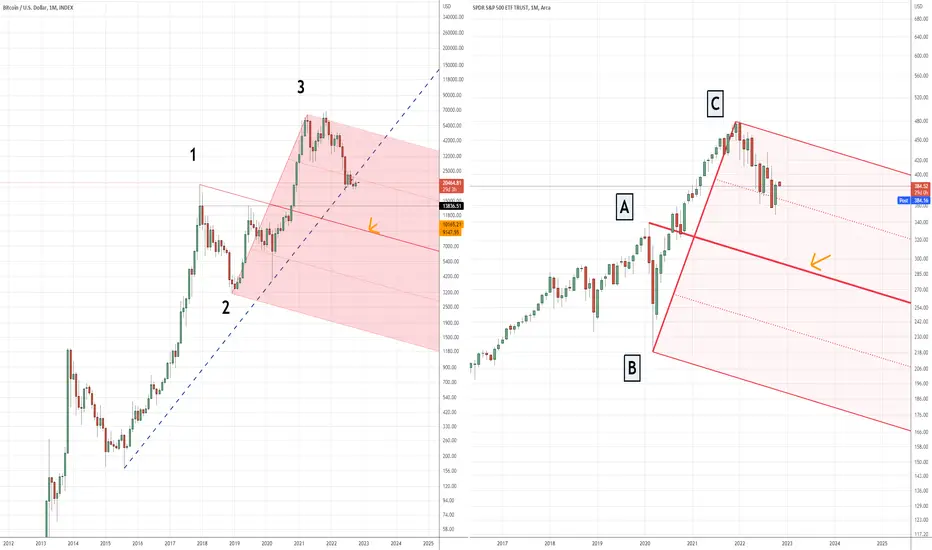
Both in in BTC and SPY charts we have Median Lines that worth a check:
In BTC prices are now under the 50% upside parallel Median Line and the current move could be a pullback of that level, in that case prices could be headed much lower , the Center Line is under 10K right now.
in SPY prices are above the 50% upside parallel but a move back under the 1/2 of the body of the last green candle ( ~373 ) should be seen as an alert to check in case of more downside there to come.
Knowing these patterns may help you have a geometrical map of where price are moving and where could be directed in the future.
No position just sharing the patterns.
In BTC prices are now under the 50% upside parallel Median Line and the current move could be a pullback of that level, in that case prices could be headed much lower , the Center Line is under 10K right now.
in SPY prices are above the 50% upside parallel but a move back under the 1/2 of the body of the last green candle ( ~373 ) should be seen as an alert to check in case of more downside there to come.
Knowing these patterns may help you have a geometrical map of where price are moving and where could be directed in the future.
No position just sharing the patterns.

관련 발행물
면책사항
해당 정보와 게시물은 금융, 투자, 트레이딩 또는 기타 유형의 조언이나 권장 사항으로 간주되지 않으며, 트레이딩뷰에서 제공하거나 보증하는 것이 아닙니다. 자세한 내용은 이용 약관을 참조하세요.
관련 발행물
면책사항
해당 정보와 게시물은 금융, 투자, 트레이딩 또는 기타 유형의 조언이나 권장 사항으로 간주되지 않으며, 트레이딩뷰에서 제공하거나 보증하는 것이 아닙니다. 자세한 내용은 이용 약관을 참조하세요.