
The Hard Road Newsletter - Weekly Analysis, auto investing machines and News
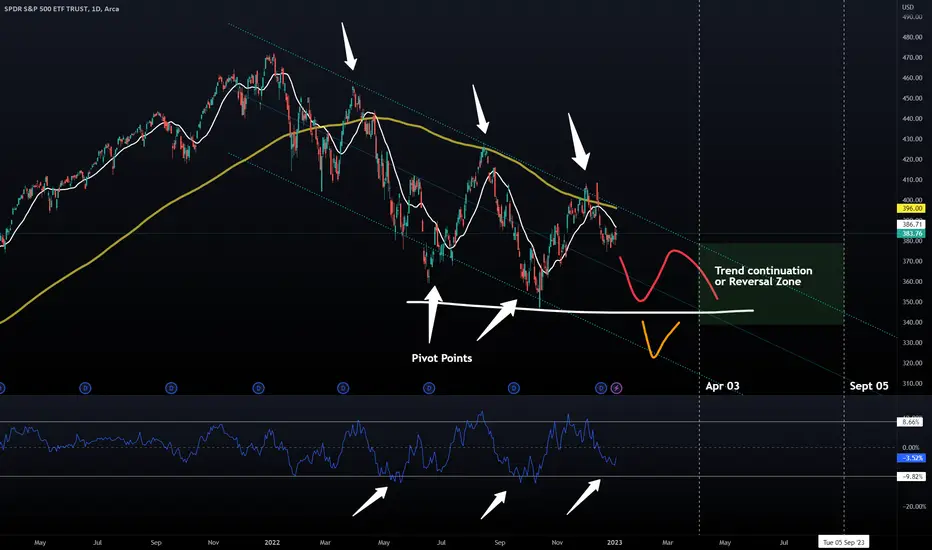
Yellow line is the 200 SMA
White Line is the 20 SMA.
Bottom indicator is the 20D Cumulative Returns
For those that don't know, Pivot Points, are reversal points of trend channels. You can see the trend marked out using a Regression Channel drawing tool inside Trading View.
We are expecting a continuation of this next wave of the downtrend, at least 1-3 weeks.
The major resistance we are seeing is $350.Note the RED drawn line for primary prediction of a support bounce and Orange as a secondary breakdown.
20D Cumulative Returns (Bottom Indicator)Looks like we're in for a bumpy ride! The current trend channel hasn't even hit the $350 support mark yet and the 20D cumulative returns are barely scratching the surface of their typical bottom of -10%. Buckle up, because it looks like we've got more room to fall over the next 1-3 weeks.
Trend Continuation or Reversal ZoneIf the trend holds at the $350 level, we may see a change in the trend between Apr 03 and Sept 05. At this point, the market will either continue to decline or reverse into a bull rally. Alternatively, the current downward trend may continue if it falls below the $350 level.
Major Indicators to Watch
FED Interest rates and money supply constriction will be a major factor in determining the market's direction. An increase in rates could mean more bear markets on the horizon. In other words, if the FED raises rates, it's time to start hibernating like a bearUnemployment Rate/Participation Rate - If layoffs increase, expect less money going into the markets.Public Sentiment - The bear market may continue if your grandma, mom, and uncle who live paycheck to paycheck are starting to save money out of fear.
The Hard Road Newsletter - Weekly Analysis, auto investing machines and News
Yellow line is the 200 SMA
White Line is the 20 SMA.
Bottom indicator is the 20D Cumulative Returns
For those that don't know, Pivot Points, are reversal points of trend channels. You can see the trend marked out using a Regression Channel drawing tool inside Trading View.
We are expecting a continuation of this next wave of the downtrend, at least 1-3 weeks.
The major resistance we are seeing is $350.Note the RED drawn line for primary prediction of a support bounce and Orange as a secondary breakdown.
20D Cumulative Returns (Bottom Indicator)Looks like we're in for a bumpy ride! The current trend channel hasn't even hit the $350 support mark yet and the 20D cumulative returns are barely scratching the surface of their typical bottom of -10%. Buckle up, because it looks like we've got more room to fall over the next 1-3 weeks.
Trend Continuation or Reversal ZoneIf the trend holds at the $350 level, we may see a change in the trend between Apr 03 and Sept 05. At this point, the market will either continue to decline or reverse into a bull rally. Alternatively, the current downward trend may continue if it falls below the $350 level.
Major Indicators to Watch
FED Interest rates and money supply constriction will be a major factor in determining the market's direction. An increase in rates could mean more bear markets on the horizon. In other words, if the FED raises rates, it's time to start hibernating like a bearUnemployment Rate/Participation Rate - If layoffs increase, expect less money going into the markets.Public Sentiment - The bear market may continue if your grandma, mom, and uncle who live paycheck to paycheck are starting to save money out of fear.
The Hard Road Newsletter - Weekly Analysis, auto investing machines and News

면책사항
해당 정보와 게시물은 금융, 투자, 트레이딩 또는 기타 유형의 조언이나 권장 사항으로 간주되지 않으며, 트레이딩뷰에서 제공하거나 보증하는 것이 아닙니다. 자세한 내용은 이용 약관을 참조하세요.
면책사항
해당 정보와 게시물은 금융, 투자, 트레이딩 또는 기타 유형의 조언이나 권장 사항으로 간주되지 않으며, 트레이딩뷰에서 제공하거나 보증하는 것이 아닙니다. 자세한 내용은 이용 약관을 참조하세요.