
Overview
Utilizing trading patterns and consistencies between several technical indicators, I believe the equity market will begin to unload soon as traders collect their profits from the recent rally and prepare for the next FOMC meeting on 19-20 March.
Trading Patterns
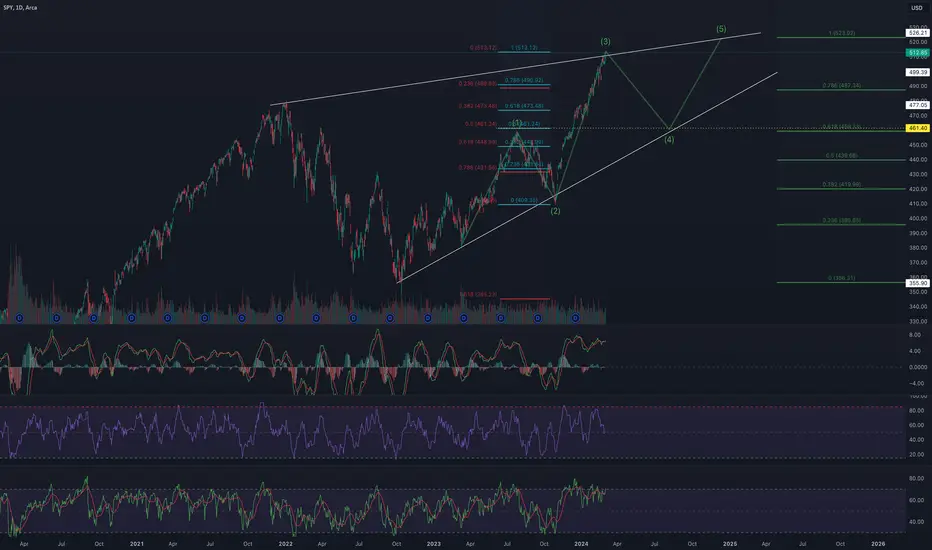
SPY is currently undergoing a rising wedge which is a bearish trading pattern. Within the wedge, I outlined an impulse wave pattern which shows SPY at what may be the peak of the third wave. Rising share price on dwindling volume, in addition to divergences spotted on the RSI, MFI, and MACD, lead me to confidently believe a dip to around $460 is approaching.
Price Target
I used the support and resistance lines of the macro rising wedge to determine the paths of the impulse waves, assuming their troughs and crests will reach the respective lines. Presuming the rules of impulse waves hold true then the fourth wave cannot end pass the crest of wave one, which falls in line with the 50% retracement level of the third wave (blue and red Fibonacci tools). This level rests at a share price near $460.
Utilizing a larger Fibonacci tool to encompass the entire rising wedge and a projected fifth wave crest as 100%, the $460 share price is around the 61.8% Fibonacci level (when used in the uptrend).
Supporting Technical Indicators
The MACD shows a divergence as well as an approaching cross over its signal line from above.

While not as prominent as MACD, the RSI also shows a divergence between the share price and peaks within the RSI oscillator. I've highlighted the divergence by placing a horizontal line at the end of the first peak. It is also reflecting overbought signals.

The MFI shows a sharp negative slope but the SPY share price is still rising. This divergence, aligned with the signals of the other two indicators, suggests the share price may be about to drop.

Utilizing trading patterns and consistencies between several technical indicators, I believe the equity market will begin to unload soon as traders collect their profits from the recent rally and prepare for the next FOMC meeting on 19-20 March.
Trading Patterns
SPY is currently undergoing a rising wedge which is a bearish trading pattern. Within the wedge, I outlined an impulse wave pattern which shows SPY at what may be the peak of the third wave. Rising share price on dwindling volume, in addition to divergences spotted on the RSI, MFI, and MACD, lead me to confidently believe a dip to around $460 is approaching.
Price Target
I used the support and resistance lines of the macro rising wedge to determine the paths of the impulse waves, assuming their troughs and crests will reach the respective lines. Presuming the rules of impulse waves hold true then the fourth wave cannot end pass the crest of wave one, which falls in line with the 50% retracement level of the third wave (blue and red Fibonacci tools). This level rests at a share price near $460.
Utilizing a larger Fibonacci tool to encompass the entire rising wedge and a projected fifth wave crest as 100%, the $460 share price is around the 61.8% Fibonacci level (when used in the uptrend).
Supporting Technical Indicators
The MACD shows a divergence as well as an approaching cross over its signal line from above.
While not as prominent as MACD, the RSI also shows a divergence between the share price and peaks within the RSI oscillator. I've highlighted the divergence by placing a horizontal line at the end of the first peak. It is also reflecting overbought signals.
The MFI shows a sharp negative slope but the SPY share price is still rising. This divergence, aligned with the signals of the other two indicators, suggests the share price may be about to drop.

관련 발행물
면책사항
해당 정보와 게시물은 금융, 투자, 트레이딩 또는 기타 유형의 조언이나 권장 사항으로 간주되지 않으며, 트레이딩뷰에서 제공하거나 보증하는 것이 아닙니다. 자세한 내용은 이용 약관을 참조하세요.
면책사항
해당 정보와 게시물은 금융, 투자, 트레이딩 또는 기타 유형의 조언이나 권장 사항으로 간주되지 않으며, 트레이딩뷰에서 제공하거나 보증하는 것이 아닙니다. 자세한 내용은 이용 약관을 참조하세요.