As we have previously discussed, we have entered a bear market and must trade smart as the market shows it's true colors and prices fluctuate with volatility.
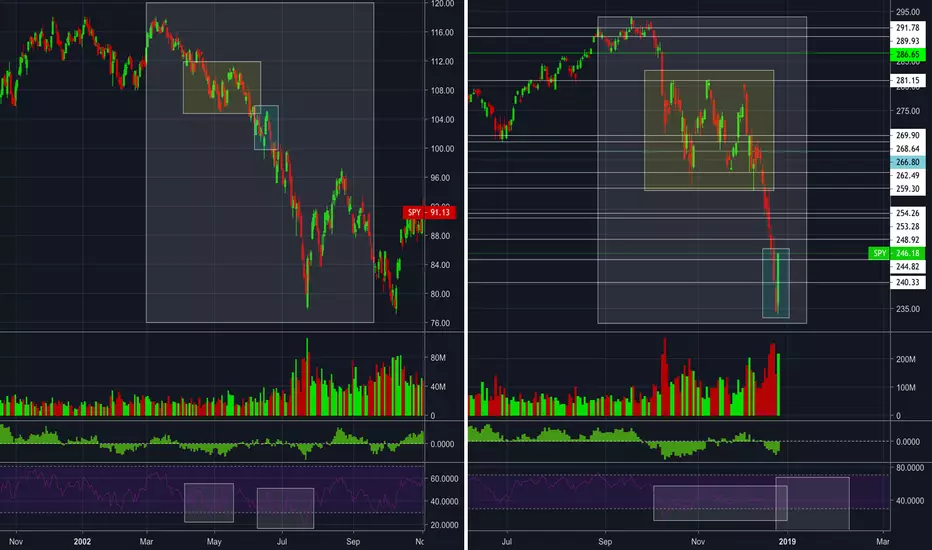
Displayed in this comparison are two extremely similar conditions from 2002 and present day SPY movement.
It's easy to see that movement from the left chart appears to be more stable than it is before coming down a significant amount more. One of my main concerns with how similar these movements are to todays, is the additional range of motion and strength in which these pullback are occurring. While we anticipated a test around SPY 213 inside the first month of 2019 these charts above suggest a larger move possible.
For those staying up with my comments on SPY, I am concerned and anticipate parabolic movement has a higher probability sooner than expected. The issue with going parabolic is it can exasperate the downtrend forcing it lower and making it less about consolidation and showing true value, and more about panic and selloff.
Displayed in this comparison are two extremely similar conditions from 2002 and present day SPY movement.
It's easy to see that movement from the left chart appears to be more stable than it is before coming down a significant amount more. One of my main concerns with how similar these movements are to todays, is the additional range of motion and strength in which these pullback are occurring. While we anticipated a test around
SPY 213 inside the first month of 2019 these charts above suggest a larger move possible. For those staying up with my comments on SPY, I am concerned and anticipate parabolic movement has a higher probability sooner than expected. The issue with going parabolic is it can exasperate the downtrend forcing it lower and making it less about consolidation and showing true value, and more about panic and selloff.

면책사항
해당 정보와 게시물은 금융, 투자, 트레이딩 또는 기타 유형의 조언이나 권장 사항으로 간주되지 않으며, 트레이딩뷰에서 제공하거나 보증하는 것이 아닙니다. 자세한 내용은 이용 약관을 참조하세요.
면책사항
해당 정보와 게시물은 금융, 투자, 트레이딩 또는 기타 유형의 조언이나 권장 사항으로 간주되지 않으며, 트레이딩뷰에서 제공하거나 보증하는 것이 아닙니다. 자세한 내용은 이용 약관을 참조하세요.