
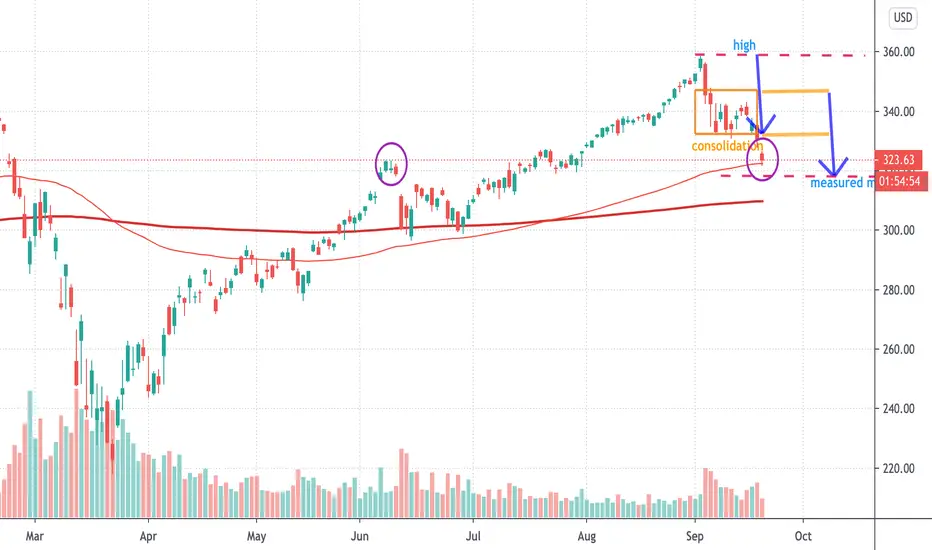
The  SPX sell-off from September 2nd highs, created a consolidation range (orange rectangle) from $330-340 approximately.
Making a measured move, with the consolidation constituting a half-way measuring flag structure (blue arrows).
100 exponential moving average is now the trend support, coincidental with June highs. Unfortunately, this is not a support trend historically market makers pay special attention to.
SPX sell-off from September 2nd highs, created a consolidation range (orange rectangle) from $330-340 approximately. Making a measured move, with the consolidation constituting a half-way measuring flag structure (blue arrows).
100 exponential moving average is now the trend support, coincidental with June highs. Unfortunately, this is not a support trend historically market makers pay special attention to.

면책사항
해당 정보와 게시물은 금융, 투자, 트레이딩 또는 기타 유형의 조언이나 권장 사항으로 간주되지 않으며, 트레이딩뷰에서 제공하거나 보증하는 것이 아닙니다. 자세한 내용은 이용 약관을 참조하세요.
면책사항
해당 정보와 게시물은 금융, 투자, 트레이딩 또는 기타 유형의 조언이나 권장 사항으로 간주되지 않으며, 트레이딩뷰에서 제공하거나 보증하는 것이 아닙니다. 자세한 내용은 이용 약관을 참조하세요.