
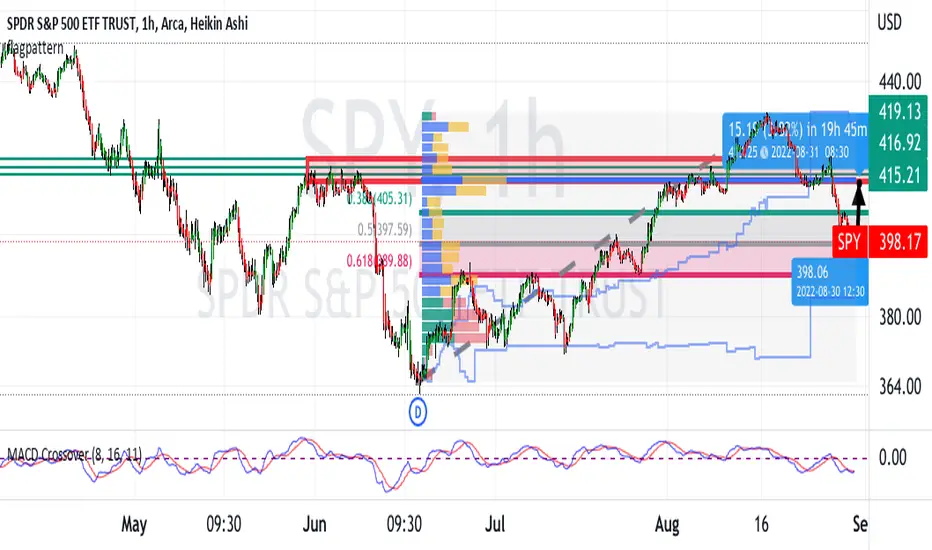
SPY bottomed June 17th and then uptrended for exactly two months and
reversed on August 16th. In this hourly chart , I show that the downtrend
retraced the uptrend to exactly the Fibonacci level 0.5
Resistance above is (1) the triple top in June as well as consolidation
zones August 22-24 and August 3-5 making the resistance zone
414-419.
The Volume Profile POC is at the Fib 0.618 level while the upper
high volume node is at the above-described resistance zone.
All in all, I see the SPY bouncing off the Fib 0.5 or Fib 0.618
and making its move towards the resistance zone.
I will play this with call options expiring September 7th.
If resistance breaks, I will close a portion of the calls
and let the rest run. If it holds, I will close them all and
roll over the profit into out of the money put options
expiring September 9th.
Please comment, what do you think?
reversed on August 16th. In this hourly chart , I show that the downtrend
retraced the uptrend to exactly the Fibonacci level 0.5
Resistance above is (1) the triple top in June as well as consolidation
zones August 22-24 and August 3-5 making the resistance zone
414-419.
The Volume Profile POC is at the Fib 0.618 level while the upper
high volume node is at the above-described resistance zone.
All in all, I see the SPY bouncing off the Fib 0.5 or Fib 0.618
and making its move towards the resistance zone.
I will play this with call options expiring September 7th.
If resistance breaks, I will close a portion of the calls
and let the rest run. If it holds, I will close them all and
roll over the profit into out of the money put options
expiring September 9th.
Please comment, what do you think?

면책사항
해당 정보와 게시물은 금융, 투자, 트레이딩 또는 기타 유형의 조언이나 권장 사항으로 간주되지 않으며, 트레이딩뷰에서 제공하거나 보증하는 것이 아닙니다. 자세한 내용은 이용 약관을 참조하세요.
면책사항
해당 정보와 게시물은 금융, 투자, 트레이딩 또는 기타 유형의 조언이나 권장 사항으로 간주되지 않으며, 트레이딩뷰에서 제공하거나 보증하는 것이 아닙니다. 자세한 내용은 이용 약관을 참조하세요.