
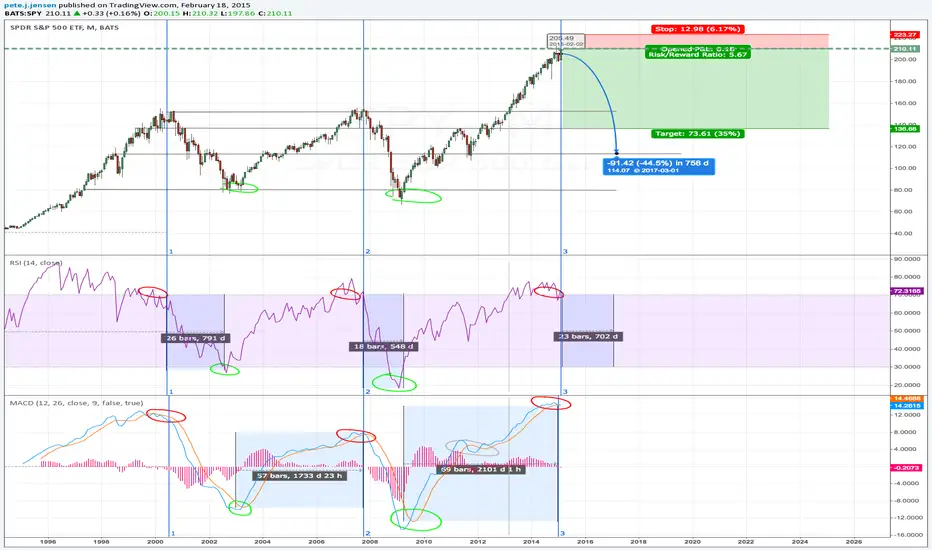
The stars are aligning for a pretty serious pullback in the US Equities Market.
The chart uses my two favorite indicators; RSI and MACD.
I've gone through and marked historical correlations on the chart for prior crashes for both indicators.
RSI going above 70; signals overvalued
RSI going below 30; signals underbought
MACD Converging (Red)
MACD Diverging (Green)
You'll see both of these correlate quite nicely with the two previous crashes.
**Projections**
I project a between a 30-40 percent pull back spanning nearly two years.
I've added a possible short position with a fairly tight tolerance for a good ratio.
I'll keep the chart updated in case we're looking at a false-top; given present valuations and P/E ratios I don't think we are.
The chart uses my two favorite indicators; RSI and MACD.
I've gone through and marked historical correlations on the chart for prior crashes for both indicators.
RSI going above 70; signals overvalued
RSI going below 30; signals underbought
MACD Converging (Red)
MACD Diverging (Green)
You'll see both of these correlate quite nicely with the two previous crashes.
**Projections**
I project a between a 30-40 percent pull back spanning nearly two years.
I've added a possible short position with a fairly tight tolerance for a good ratio.
I'll keep the chart updated in case we're looking at a false-top; given present valuations and P/E ratios I don't think we are.

면책사항
해당 정보와 게시물은 금융, 투자, 트레이딩 또는 기타 유형의 조언이나 권장 사항으로 간주되지 않으며, 트레이딩뷰에서 제공하거나 보증하는 것이 아닙니다. 자세한 내용은 이용 약관을 참조하세요.
면책사항
해당 정보와 게시물은 금융, 투자, 트레이딩 또는 기타 유형의 조언이나 권장 사항으로 간주되지 않으며, 트레이딩뷰에서 제공하거나 보증하는 것이 아닙니다. 자세한 내용은 이용 약관을 참조하세요.