
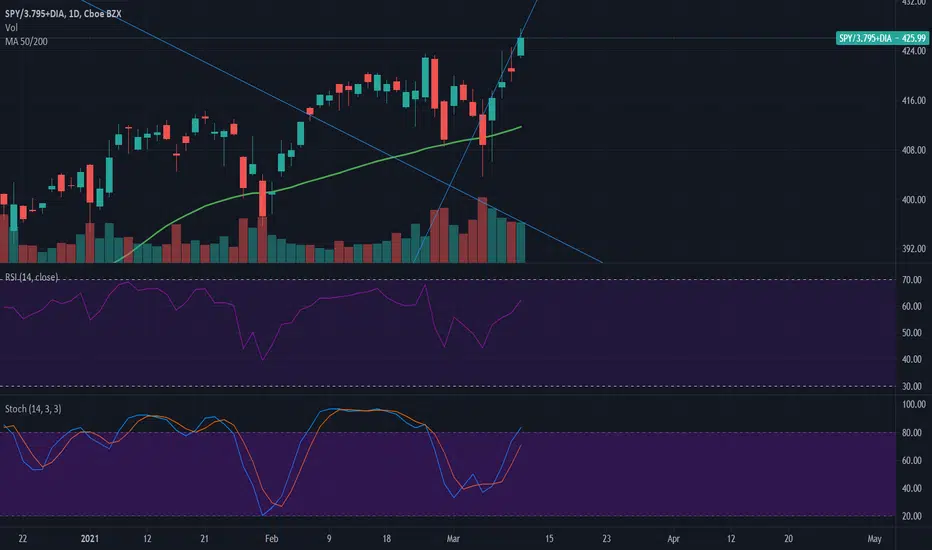
Looks to be a divergence forming in the SPY/DIA chart between purchasing volume and valuation. Stoch is also approaching overbought but RSI is still within a good limit. Could indicate a coming pause in the cycling of the market after the recent upswing in value/non-tech companies. Could be a good time to get into some value companies or to check your charts for the same divergence and hedge or short if it makes sense.
Similar divergence found on the daily SYF, CVX, and KHC daily charts. All three are also reaching overbought levels in either the Stoch 14/3/3, RSI or both.
Similar divergence found on the daily SYF, CVX, and KHC daily charts. All three are also reaching overbought levels in either the Stoch 14/3/3, RSI or both.

면책사항
해당 정보와 게시물은 금융, 투자, 트레이딩 또는 기타 유형의 조언이나 권장 사항으로 간주되지 않으며, 트레이딩뷰에서 제공하거나 보증하는 것이 아닙니다. 자세한 내용은 이용 약관을 참조하세요.
면책사항
해당 정보와 게시물은 금융, 투자, 트레이딩 또는 기타 유형의 조언이나 권장 사항으로 간주되지 않으며, 트레이딩뷰에서 제공하거나 보증하는 것이 아닙니다. 자세한 내용은 이용 약관을 참조하세요.