
Important:
****** With INTRS symbol added to compare and find points of bottoming, please enable AUTO and % to the chart) ********
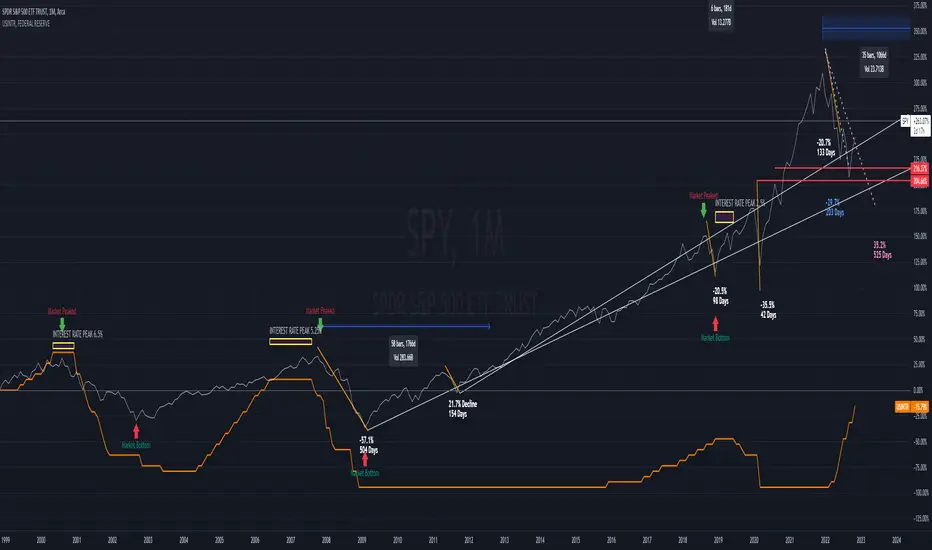
I added the Interest rate line to check how long will it take to the market to start climbing out from bottom Pivot (once reached there), while comparing it to other yearly crises
When Interest rate gets to the highest point during a down trend period (Bear market), it will stay there for quite a while (about 3-5 months) before the fed starts decreasing interest rates again
2000 Dot-Com Crisis
Interest rates peaked at 6.5%
5/2000-12/2000 7 months interest rate stayed at peak
8/2000 Market peaked at 152
9/2002 - Market hit bottom (Pivot)
5/2000- 9/2002 From first time market hit highest Interest rate till bear market bottomed
8/2000 - 6/2007 Market took almost 7 years to go back to highest peak from 2000
2008 house market crisis
Interest rates peaked at 5.25%
6/2006-8/2007 (1 year and 2 months stayed at peak)
10/2007 Market peaked at 154 (***** ONLY 2 POINTS HIGHER THAN 2000 PEAK ******)
2/2009 Market hit bottom (Pivot)
6/2006- 2/2009 From first time market hit highest Interest rate till bear market bottomed
10/2007-03/2013 Market took 5.5 years to go back to highest peak from 2007

면책사항
해당 정보와 게시물은 금융, 투자, 트레이딩 또는 기타 유형의 조언이나 권장 사항으로 간주되지 않으며, 트레이딩뷰에서 제공하거나 보증하는 것이 아닙니다. 자세한 내용은 이용 약관을 참조하세요.
면책사항
해당 정보와 게시물은 금융, 투자, 트레이딩 또는 기타 유형의 조언이나 권장 사항으로 간주되지 않으며, 트레이딩뷰에서 제공하거나 보증하는 것이 아닙니다. 자세한 내용은 이용 약관을 참조하세요.