
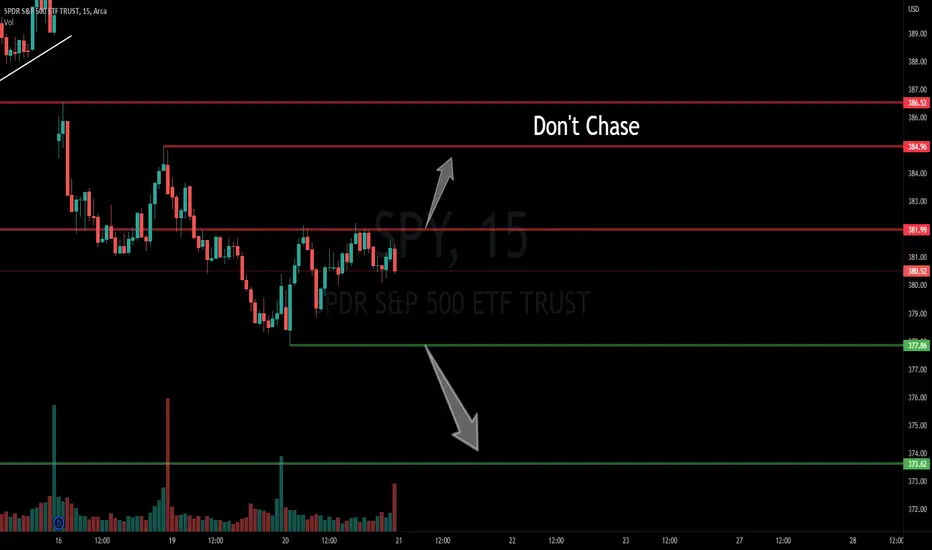
Yea, so basically these are my supply and demand levels on a shorter time frame, I graphed these on 15-30 minute time frames. What I usually do is I see whatever level we break in the market, if we fully close above with not a lot of opposing pressure, we can take calls or puts respectively. I also take calls and puts off the rejection of these because I look to see if the candle is being rejected or being pushed up/down into the next zone through pressure. This is a very bad explanation but take from it what you will. Enjoy, and Good Trading Lads!

면책사항
해당 정보와 게시물은 금융, 투자, 트레이딩 또는 기타 유형의 조언이나 권장 사항으로 간주되지 않으며, 트레이딩뷰에서 제공하거나 보증하는 것이 아닙니다. 자세한 내용은 이용 약관을 참조하세요.
면책사항
해당 정보와 게시물은 금융, 투자, 트레이딩 또는 기타 유형의 조언이나 권장 사항으로 간주되지 않으며, 트레이딩뷰에서 제공하거나 보증하는 것이 아닙니다. 자세한 내용은 이용 약관을 참조하세요.