 SPY
SPY Last week's
SPY $595 Put 3/10 ran for 66% from $480 up to $1,420. The last two weeks, the market has suffered a controlled pullback. So far it has been cautious selling rather than outright panic. While fear has entered the market, it has yet to reach capitulation, where there would be significantly more potential downside. The key level to watch long-term is the 200SMA on the daily chart, currently at $568.45. This level, which hasn't been tested in 16 months, could signal a Stage 4 selloff, a more aggressive and potentially prolonged downward trend.
Here are this week's
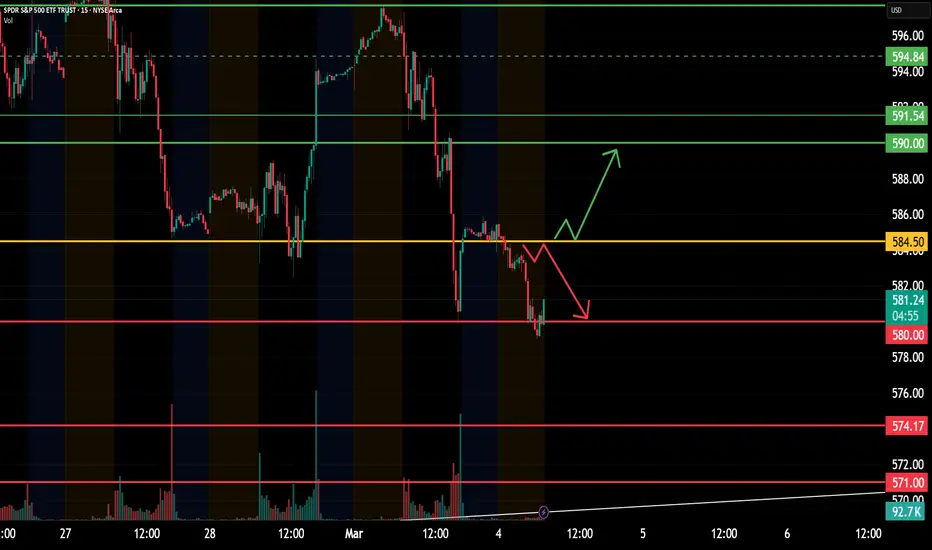
SPY Options:(15-30 minute candle closes for confirmation and stop-loss)
📜 $580 PUT 3/17
Entry: Breakdown and failed retest of $584.50
Target 🎯 : $580, $574, $571
📜 $590 CALL 3/17
Confirmed breakout over $584.50
Target 🎯 : $590, $591.50, $594

I trade live on Discord - pennybo.is/PB-FREE
관련 발행물
면책사항
해당 정보와 게시물은 금융, 투자, 트레이딩 또는 기타 유형의 조언이나 권장 사항으로 간주되지 않으며, 트레이딩뷰에서 제공하거나 보증하는 것이 아닙니다. 자세한 내용은 이용 약관을 참조하세요.
I trade live on Discord - pennybo.is/PB-FREE
관련 발행물
면책사항
해당 정보와 게시물은 금융, 투자, 트레이딩 또는 기타 유형의 조언이나 권장 사항으로 간주되지 않으며, 트레이딩뷰에서 제공하거나 보증하는 것이 아닙니다. 자세한 내용은 이용 약관을 참조하세요.