
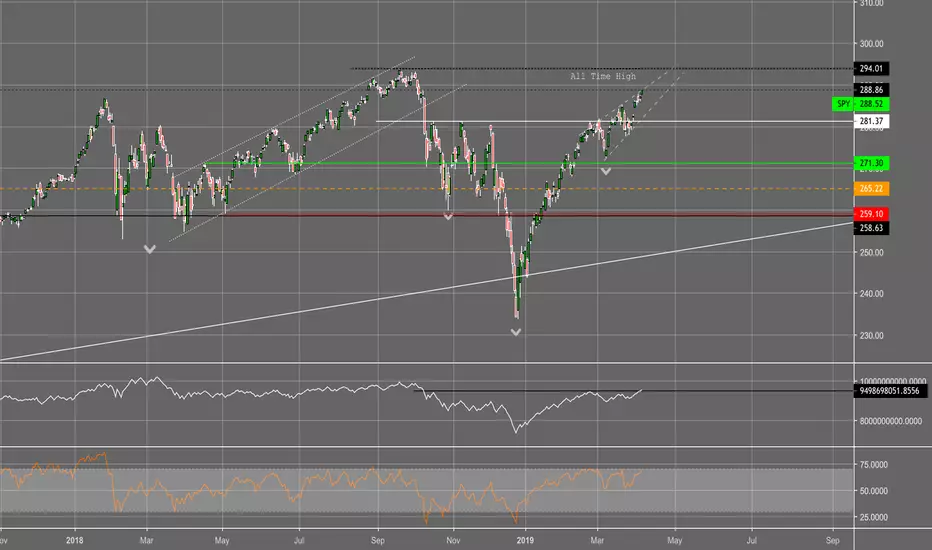
Strong rising wedge for the S&P. Could this take a healthy fall back down...RSI implies it is overbought
Also we had a parabolic move up from the lows of December/Jan...with no real healthy moves down for a recovery period on the way back up
Hypothesis: price reaches near ATH to fail at resistant levels. If it price proves to move back down, I think it could make a W shaped pattern before a move back up or complete a right shoulder for a inverse head and shoulders pattern.
Also we had a parabolic move up from the lows of December/Jan...with no real healthy moves down for a recovery period on the way back up
Hypothesis: price reaches near ATH to fail at resistant levels. If it price proves to move back down, I think it could make a W shaped pattern before a move back up or complete a right shoulder for a inverse head and shoulders pattern.
액티브 트레이드
The S&P has now fallen out of the rising wedge and has accomplished target 1
면책사항
해당 정보와 게시물은 금융, 투자, 트레이딩 또는 기타 유형의 조언이나 권장 사항으로 간주되지 않으며, 트레이딩뷰에서 제공하거나 보증하는 것이 아닙니다. 자세한 내용은 이용 약관을 참조하세요.
면책사항
해당 정보와 게시물은 금융, 투자, 트레이딩 또는 기타 유형의 조언이나 권장 사항으로 간주되지 않으며, 트레이딩뷰에서 제공하거나 보증하는 것이 아닙니다. 자세한 내용은 이용 약관을 참조하세요.