
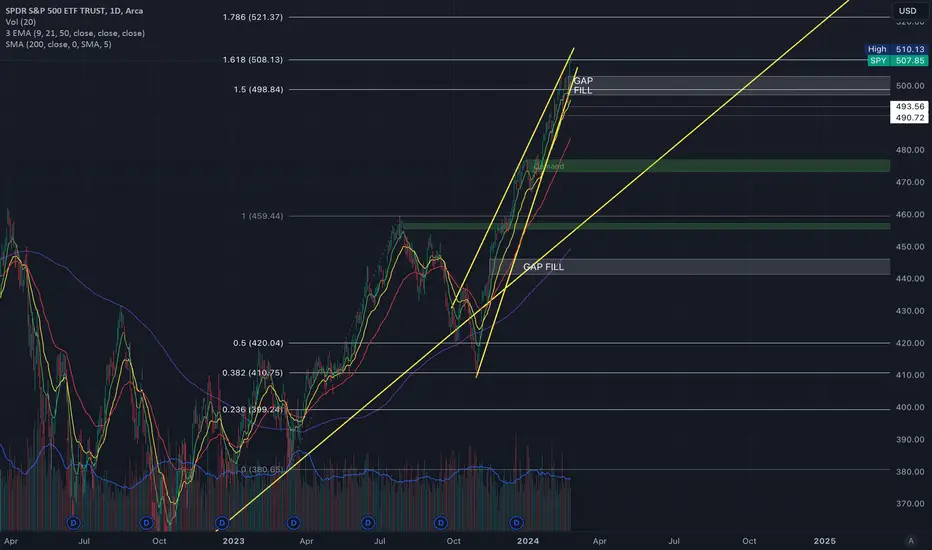
The Daily chart showed that price started below the 9EMA for this week and gapped up above the 9EMA on Thursday and closed the week well above it. Gap fill is at 497.37 and Support is at 503.50 which was a previous daily high. There is a Double Bearish Divergence on the RSI from a high of 74.77 to 72.56 and closed the week on a bearish candle that closed +0.07% with a 68.53 RSI.
Based on a Fibonacci Retracement (380.65 -> 459.44 bounced off the 0.382 Fib at 410.75) and Extension (2.0 at 538.23), if price holds 508.13 (1.618) it can run to 521.37 (1.786).
Based on a Fibonacci Retracement (380.65 -> 459.44 bounced off the 0.382 Fib at 410.75) and Extension (2.0 at 538.23), if price holds 508.13 (1.618) it can run to 521.37 (1.786).

면책사항
해당 정보와 게시물은 금융, 투자, 트레이딩 또는 기타 유형의 조언이나 권장 사항으로 간주되지 않으며, 트레이딩뷰에서 제공하거나 보증하는 것이 아닙니다. 자세한 내용은 이용 약관을 참조하세요.
면책사항
해당 정보와 게시물은 금융, 투자, 트레이딩 또는 기타 유형의 조언이나 권장 사항으로 간주되지 않으며, 트레이딩뷰에서 제공하거나 보증하는 것이 아닙니다. 자세한 내용은 이용 약관을 참조하세요.