Greetings everyone,
(Key Takeaways) - (MONTHLY TIMEFRAME)
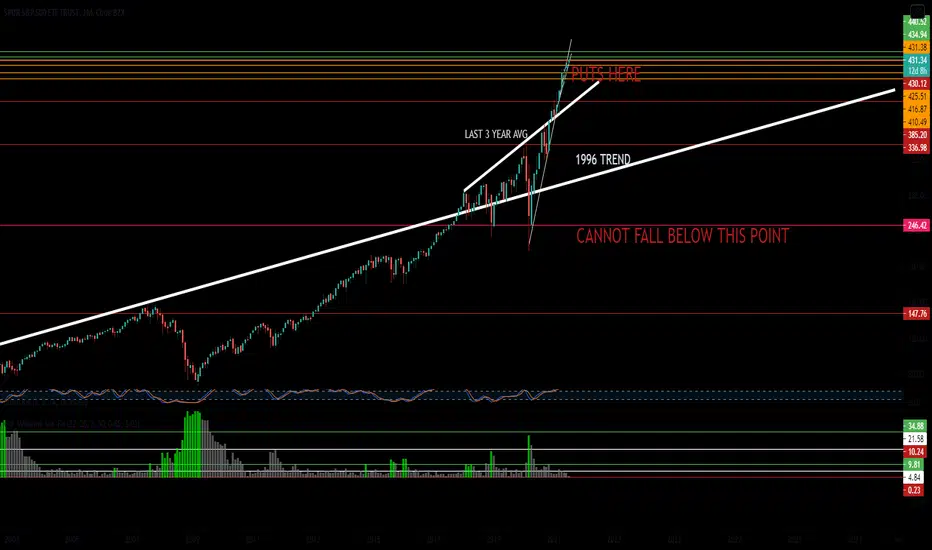
This SPY chart dating back to the date it was listed on the market back in 1993 gives us a wider point of view of the market.
Overall the sentiment is still bullish-long. However, the next couple of months can be bloodbaths.
Easy to say we are a bit over-extended? The smallest white trendline (2017-NOW) is showing signs of weakness.
Possible downward move towards $416.00 in the next couple of weeks.
The longer white trendline shows a possible 100 point loss down to $340.00.
Keep in mind we are entering earnings season so the risk is very high.
(My sentiment)
Bearish - Short term
Bullish - Long term
(Key Takeaways) - (MONTHLY TIMEFRAME)
This
SPY chart dating back to the date it was listed on the market back in 1993 gives us a wider point of view of the market.Overall the sentiment is still bullish-long. However, the next couple of months can be bloodbaths.
Easy to say we are a bit over-extended? The smallest white trendline (2017-NOW) is showing signs of weakness.
Possible downward move towards $416.00 in the next couple of weeks.
The longer white trendline shows a possible 100 point loss down to $340.00.
Keep in mind we are entering earnings season so the risk is very high.
(My sentiment)
Bearish - Short term
Bullish - Long term

관련 발행물
면책사항
해당 정보와 게시물은 금융, 투자, 트레이딩 또는 기타 유형의 조언이나 권장 사항으로 간주되지 않으며, 트레이딩뷰에서 제공하거나 보증하는 것이 아닙니다. 자세한 내용은 이용 약관을 참조하세요.
면책사항
해당 정보와 게시물은 금융, 투자, 트레이딩 또는 기타 유형의 조언이나 권장 사항으로 간주되지 않으며, 트레이딩뷰에서 제공하거나 보증하는 것이 아닙니다. 자세한 내용은 이용 약관을 참조하세요.