
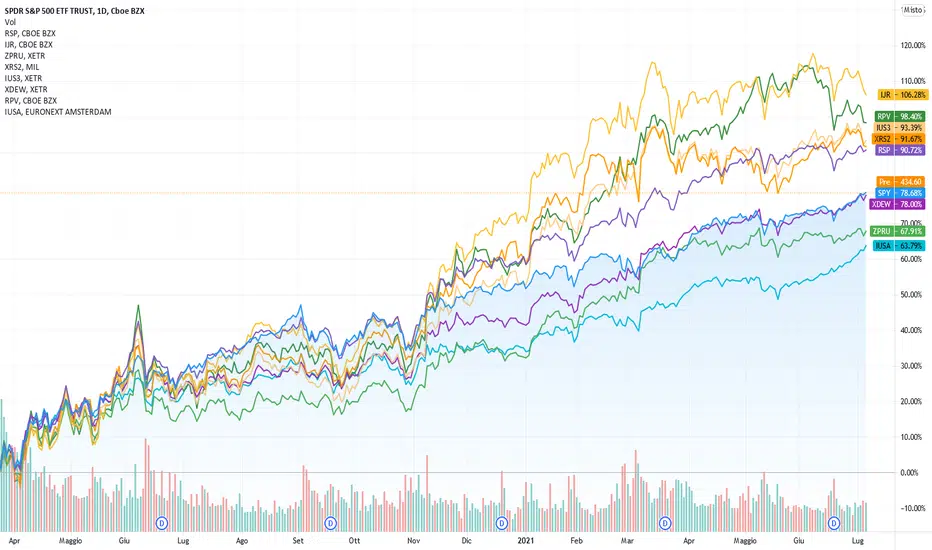
This image shows the performance of different ETF strategies after a market crash. For each strategy the chart shows a US listed ETF (first one) and one or more EU listed ETFs (all the following ones), this because the EUR/USD exchange creates a difference in the US and EU ETFs performance.
- bluish - S&P 500 baseline ( SPY / IUSA )
- purpleish - S&P 500 Equal Weight strategy ( RSP / XDEW )
- yellowish - SmallCap strategy - S&P Smallcap 600 and Russell 2000 ( IJR / IUS3 / XRS2 )
- greenish - S&P 500 Value strategy ( RPV / ZPRU )
The three strategies, Equal Weight, SmallCap and Value, all beated the baseline S&P 500.
- bluish - S&P 500 baseline ( SPY / IUSA )
- purpleish - S&P 500 Equal Weight strategy ( RSP / XDEW )
- yellowish - SmallCap strategy - S&P Smallcap 600 and Russell 2000 ( IJR / IUS3 / XRS2 )
- greenish - S&P 500 Value strategy ( RPV / ZPRU )
The three strategies, Equal Weight, SmallCap and Value, all beated the baseline S&P 500.

면책사항
해당 정보와 게시물은 금융, 투자, 트레이딩 또는 기타 유형의 조언이나 권장 사항으로 간주되지 않으며, 트레이딩뷰에서 제공하거나 보증하는 것이 아닙니다. 자세한 내용은 이용 약관을 참조하세요.
면책사항
해당 정보와 게시물은 금융, 투자, 트레이딩 또는 기타 유형의 조언이나 권장 사항으로 간주되지 않으며, 트레이딩뷰에서 제공하거나 보증하는 것이 아닙니다. 자세한 내용은 이용 약관을 참조하세요.