
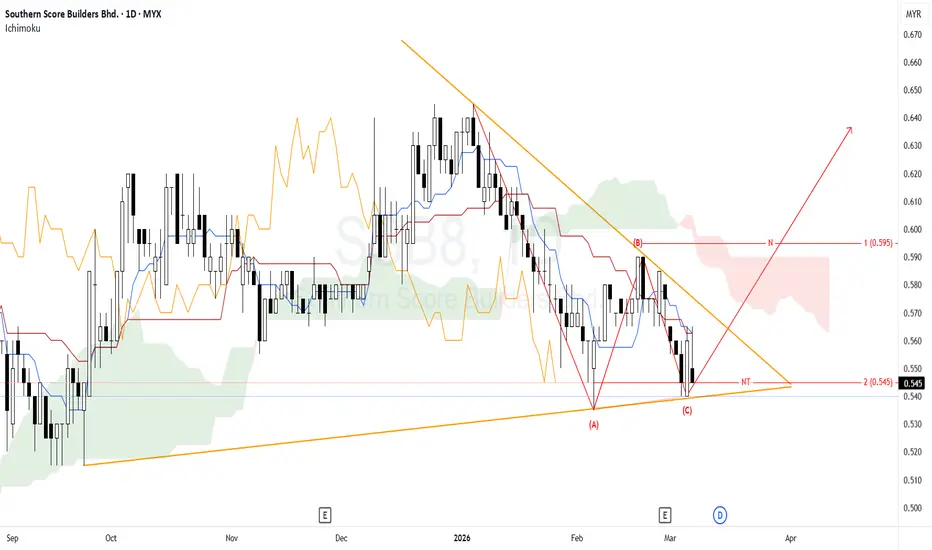
The chart is trying to build a double bottom at 0.540–0.545, and the A-B-C structure supports an N-wave projection toward 0.590.
If price can break and hold above the 0.585–0.595 neckline, the pattern would strengthen and the NT projection toward 0.630–0.640 becomes a realistic technical objective.
The bullish structure is not confirmed yet. Price is still below an important descending resistance line and close to Kumo overhead resistance.
If 0.540–0.545 fails, the double bottom is compromised, and the bullish projection becomes much less reliable.
Critical support: 0.540–0.545
Near resistance: 0.565
Confirmation / neckline: 0.585–0.595
N projection: ~0.590
NT projection: 0.630–0.640
Bullish Reversal (Early)
Price holds 0.540–0.545 and rebounds above 0.565.
Reversal attempt becomes stronger, but still not fully confirmed.
Bullish Confirmation
Price breaks and closes above 0.585–0.595.
Opens path toward N projection ~0.590, then higher.
Bullish Continuation / NT Scenario
Price holds above neckline and continues upward with momentum.
Upside extension toward NT zone 0.630–0.640 becomes possible.
Neutral / Sideways
Price holds support but fails to break 0.565–0.595.
Market is still undecided; pattern remains incomplete.
Bearish Invalidation
Price breaks below 0.540–0.545 and cannot recover.
Double-bottom structure weakens or fails. Pattern is invalidated, downside risk increases.
Bearish Breakdown Confirmation
Price closes below support and retest fails under 0.540–0.545. Support may turn into resistance.
Chart shifts from reversal attempt back into weakness
Notes:
1. Analysis for education purpose only.
2. Trade at your own risk.
If price can break and hold above the 0.585–0.595 neckline, the pattern would strengthen and the NT projection toward 0.630–0.640 becomes a realistic technical objective.
The bullish structure is not confirmed yet. Price is still below an important descending resistance line and close to Kumo overhead resistance.
If 0.540–0.545 fails, the double bottom is compromised, and the bullish projection becomes much less reliable.
Critical support: 0.540–0.545
Near resistance: 0.565
Confirmation / neckline: 0.585–0.595
N projection: ~0.590
NT projection: 0.630–0.640
Bullish Reversal (Early)
Price holds 0.540–0.545 and rebounds above 0.565.
Reversal attempt becomes stronger, but still not fully confirmed.
Bullish Confirmation
Price breaks and closes above 0.585–0.595.
Opens path toward N projection ~0.590, then higher.
Bullish Continuation / NT Scenario
Price holds above neckline and continues upward with momentum.
Upside extension toward NT zone 0.630–0.640 becomes possible.
Neutral / Sideways
Price holds support but fails to break 0.565–0.595.
Market is still undecided; pattern remains incomplete.
Bearish Invalidation
Price breaks below 0.540–0.545 and cannot recover.
Double-bottom structure weakens or fails. Pattern is invalidated, downside risk increases.
Bearish Breakdown Confirmation
Price closes below support and retest fails under 0.540–0.545. Support may turn into resistance.
Chart shifts from reversal attempt back into weakness
Notes:
1. Analysis for education purpose only.
2. Trade at your own risk.
거래청산: 타겟 닿음
Reached target
면책사항
해당 정보와 게시물은 금융, 투자, 트레이딩 또는 기타 유형의 조언이나 권장 사항으로 간주되지 않으며, 트레이딩뷰에서 제공하거나 보증하는 것이 아닙니다. 자세한 내용은 이용 약관을 참조하세요.
면책사항
해당 정보와 게시물은 금융, 투자, 트레이딩 또는 기타 유형의 조언이나 권장 사항으로 간주되지 않으며, 트레이딩뷰에서 제공하거나 보증하는 것이 아닙니다. 자세한 내용은 이용 약관을 참조하세요.