
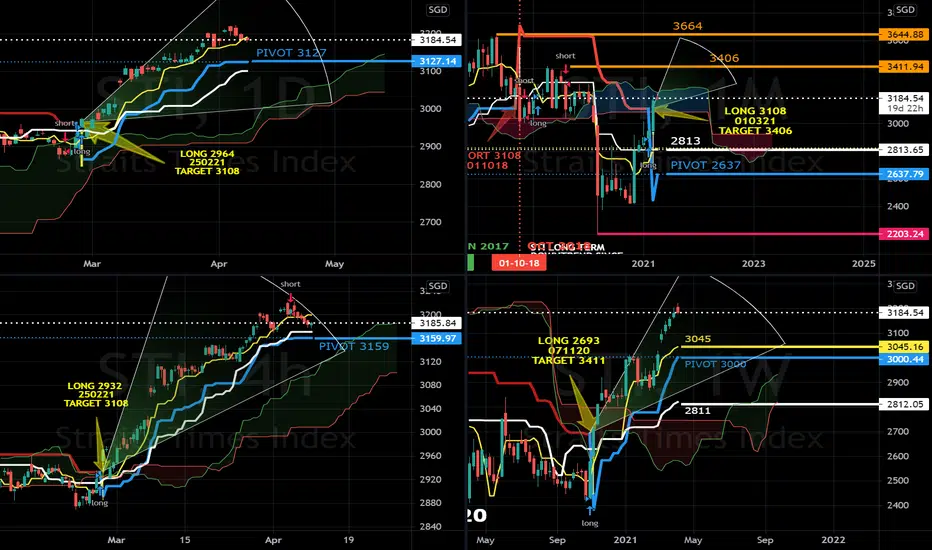
With all time frames bullish supported by 70% of its major components in a bullish multi time frame uptrends (refer to the STI Matrix), the STI approaches the upper end of its 10 year channel at 3406.
The STI has been broadly in a trading range between 2300 to 3400 since 2011 and a break of the lower range of 2300 was tested in the pandemic drop in feb 20 which hit a low of 2203. We now see a test upwards of 3406 which may occur if the uptrend of the STI continues in the medium term.
PIVOT 3127
Long positions above 3127 for 3406 and 3664
Short positions below 3127 for 3000 and 2637
The STI has been broadly in a trading range between 2300 to 3400 since 2011 and a break of the lower range of 2300 was tested in the pandemic drop in feb 20 which hit a low of 2203. We now see a test upwards of 3406 which may occur if the uptrend of the STI continues in the medium term.
PIVOT 3127
Long positions above 3127 for 3406 and 3664
Short positions below 3127 for 3000 and 2637

Quant Strategic Singapore
면책사항
해당 정보와 게시물은 금융, 투자, 트레이딩 또는 기타 유형의 조언이나 권장 사항으로 간주되지 않으며, 트레이딩뷰에서 제공하거나 보증하는 것이 아닙니다. 자세한 내용은 이용 약관을 참조하세요.
Quant Strategic Singapore
면책사항
해당 정보와 게시물은 금융, 투자, 트레이딩 또는 기타 유형의 조언이나 권장 사항으로 간주되지 않으며, 트레이딩뷰에서 제공하거나 보증하는 것이 아닙니다. 자세한 내용은 이용 약관을 참조하세요.