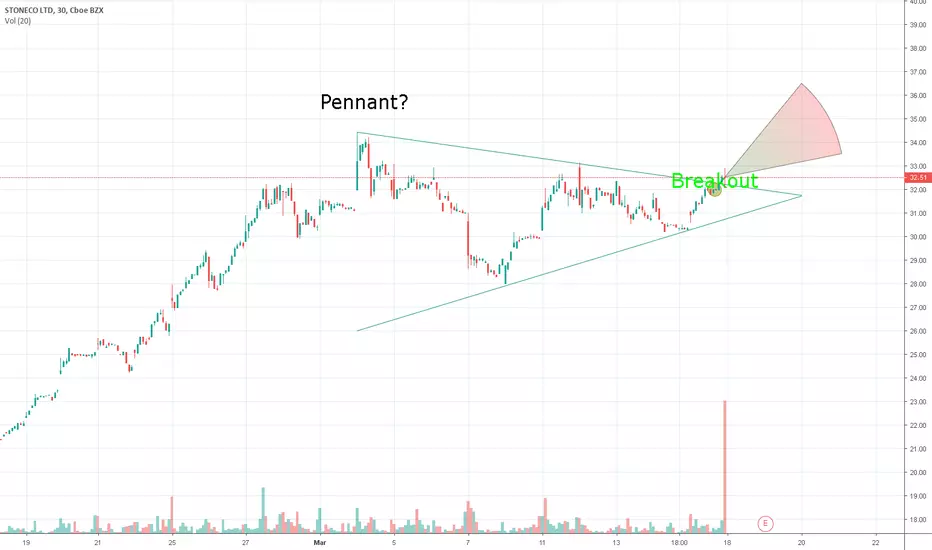
 STNE This is my first time doing chart patterns, but I think I am on to something here. We all know that STNE is a good long stock, but due to the recent bottom, it has been even more of a buy. If we look at the chart provided below, we can see that it almost fits the Pennant chart pattern. Im thinking once earnings comes, its gonna skyrocket all the way to $36.50, and then come down a bit due to people taking profits. Again this isn't really comprehensive and its my first time doing something like this so please take it with a grain of salt. Thank you.
노트
Sorry, the predicted pattern on the chart doesn't reflect what I am saying, instead, look at the chart in the comments.
면책사항
해당 정보와 게시물은 금융, 투자, 트레이딩 또는 기타 유형의 조언이나 권장 사항으로 간주되지 않으며, 트레이딩뷰에서 제공하거나 보증하는 것이 아닙니다. 자세한 내용은 이용 약관을 참조하세요.
면책사항
해당 정보와 게시물은 금융, 투자, 트레이딩 또는 기타 유형의 조언이나 권장 사항으로 간주되지 않으며, 트레이딩뷰에서 제공하거나 보증하는 것이 아닙니다. 자세한 내용은 이용 약관을 참조하세요.